Figure 5.
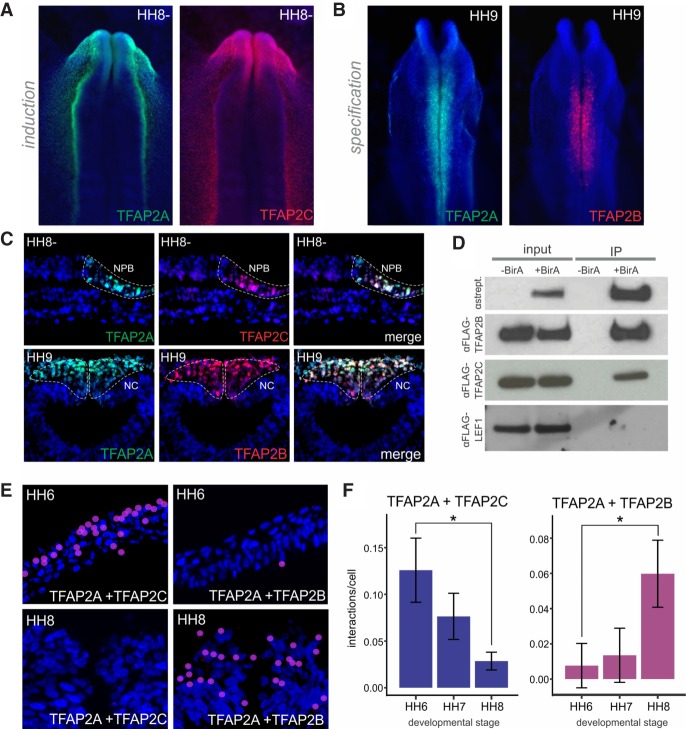
TFAP2A switches heterodimeric partners during neural crest development. (A) Immunohistochemistry for TFAP2A (green) and TFAP2C (red) shows strong colocalization at the neural plate border. (B) Immunohistochemistry for TFAP2A (green) and TFAP2B (red) shows colocalization in the neural crest. (C) Transverse sections showing overlap in expression of TFAP2A and TFAP2C at the neural plate border and nonneural ectoderm, and TFAP2A and TFAP2B at the dorsal neural tube. (D) Coimmunoprecipitation of Avi-tagged TFAP2A and FLAG-tagged TFAP2B, TFAP2C, and LEF1. Constructs for biotagged proteins were transfected into chick embryos, and pulldown was conducted with or without the presence of the BirA enzyme. In the presence of BirA, biotinylated TFAP2A coimmunoprecipitates both FLAG-TFAP2B and FLAG-TFAP2C but is unable to pull down LEF1. (E) Proximity ligation assays (PLAs) visualized in transverse sections of the neural plate border and the neural crest. Positive interactions, indicated by red puncta, are enriched for TFAP2A/C at the neural plate border and TFAP2A/B at the neural crest. (F) Quantification of PLA puncta in embryos at three developmental stages (HH6–HH8) reveals a graded decrease in the number of interactions per cell between TFAP2A and TFAP2C over time, as well as an increase in TFAP2A/TFAP2B interactions over time. The number of interactions was normalized to those detected in the neural plate/ventral neural tube to account for differences in background fluorescence. Error bars, SE. (HH) Hamburger Hamilton; (NPB) neural plate border; (NC) neural crest. (*) P ≤ 0.05 (for number of embryos analyzed, see also Supplemental Table S1).

