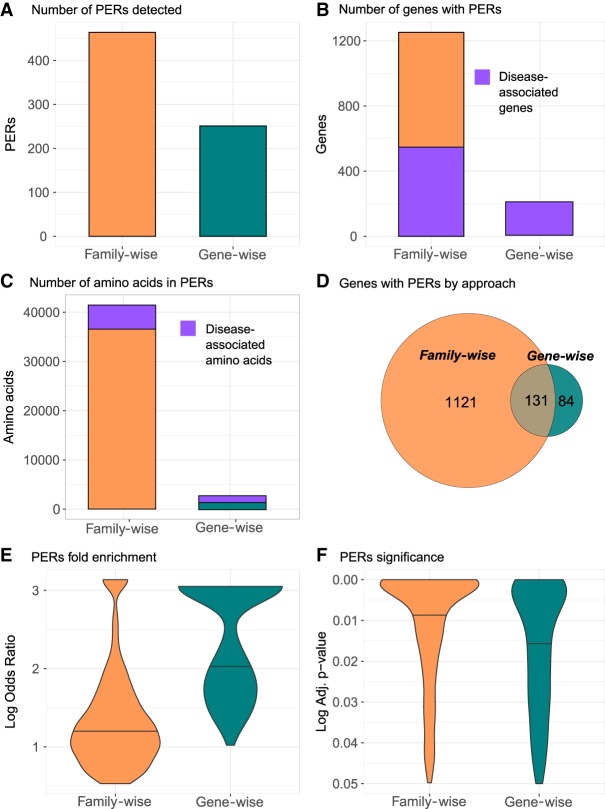
Figure 2.
PERs detected with the family-wise and gene-wise burden analyses. Summary statistics for family-wise (orange) and gene-wise (green) approaches are shown for number of PERs detected (A), number of genes with PERs (B), and number of amino acids involved in in PERs (C). For B and C, the number of genes and amino acids associated to disease is shown in purple. (D) To reflect gene with PERs distribution by approach, a Venn diagram is shown. (E,F) Overall enrichment (log odds ratio) and significance (adjusted P-value) distribution of all PERs detected in each approach are shown in E and F, respectively.

