Figure 4.
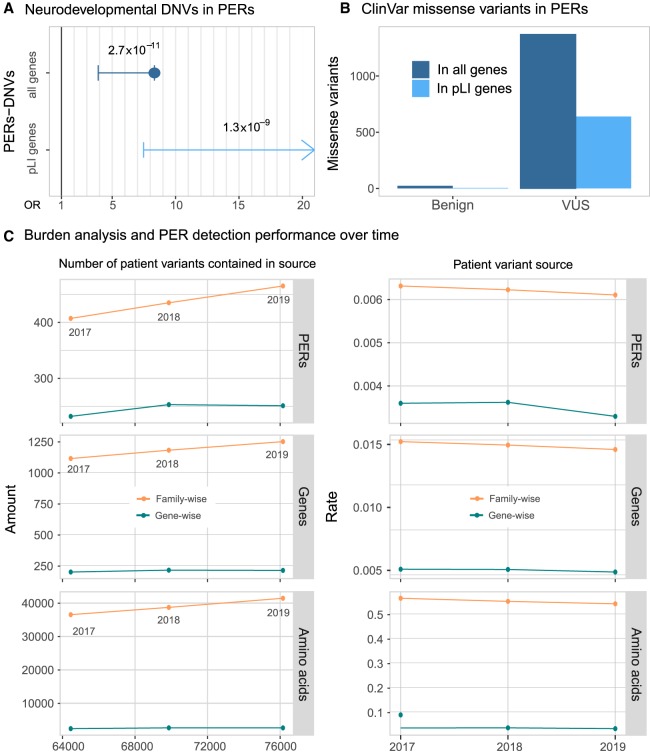
Disease-causing variants are enriched in PERs. (A) Neurodevelopmental disorder DNVs inside PERs. Case and control comparison of DNVs inside PERs retrieved from Heyne et al. (2018) is shown for all genes (blue; OR = 8.33, 95% C.I. = 3.90-Inf, P-value = 2.72 × 10⁻¹¹) and genes with high probability of being loss-of-function intolerant (light blue; OR = Inf, 95%C.I. = 7.48-Inf, P-value = 1.34 × 10⁻⁹). Fold enrichment observed in cases was calculated with a one-sided Fisher's exact test. Resulting odds ratio (OR) with 95% confidence and corresponding P-values are shown in the horizontal axis. (B) ClinVar missense variants (from October 2019 release) inside PERs with benign and unknown (VUS) clinical significance. The number of variants observed is shown considering all genes (blue) and pLI > 0.9 genes only (light blue). (C) Burden analysis performance over time. PER detection was performed with patient variants reported until 2017 and 2018 and compared with the current 2019 data set analysis. (Left) Overall amount of PERs, amino acid, and genes detected as a function of the number of input patient variants. (Right) Rate of PERs, genes, and amino acids detected per patient variant contained in 2017, 2018, and 2019 sources.

