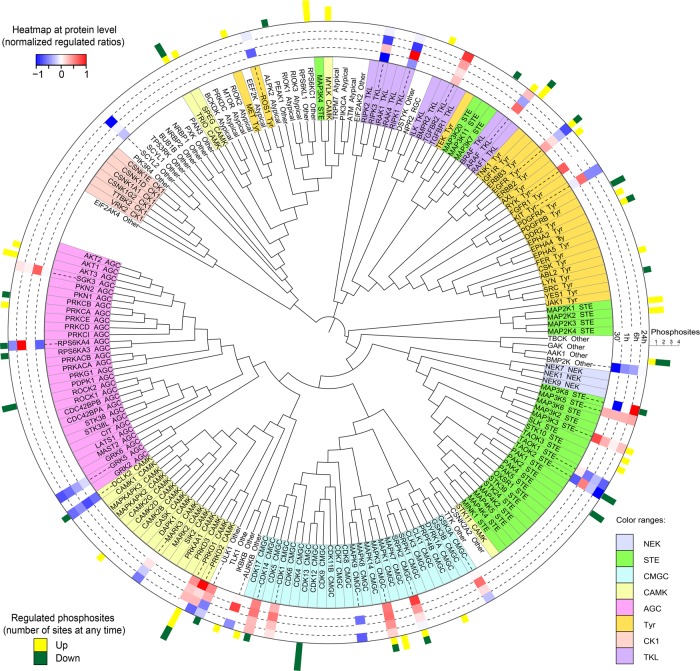
Figure 3.
Commitment to the osteoblast lineage leads to numerous alterations in kinase expression and phosphorylation status. Identified and quantified kinases were ordered by the phylogenetic distance of their kinase domains and aligned using iTOL. Color codes for distinct kinase families are shown in the right bottom corner. Histogram in the inner ring represents the regulation at protein level at the corresponding time points, whereas bars on outer ring show number and direction of regulated phosphorylation sites.

