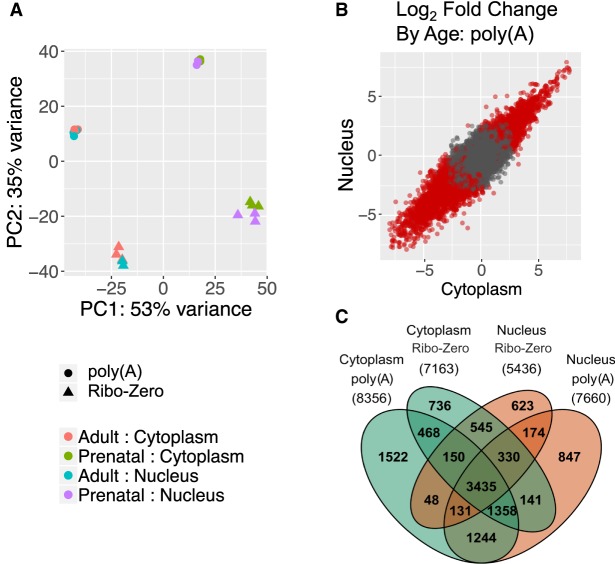
Figure 1.
Developmental gene expression changes in human cortex are similarly detectable in nuclear and cytoplasmic RNA. (A) Principal component analysis. PC1 separates the samples by age and PC2 separates the samples by library type so that nuclear and cytoplasmic samples from the same donors cluster together. (B) Log2 fold change of gene expression across age measured in cytoplasmic and nuclear RNA [poly(A)+ library preparation shown only]. Red dots indicate FDR ≤ 0.05. (C) Venn diagram of differentially expressed genes by age [FDR ≤ 0.05; abs(log2 fold change) ≥ 1] measured in both fractions and library types. The total number of genes for each group is listed in parentheses.

