Figure 5.
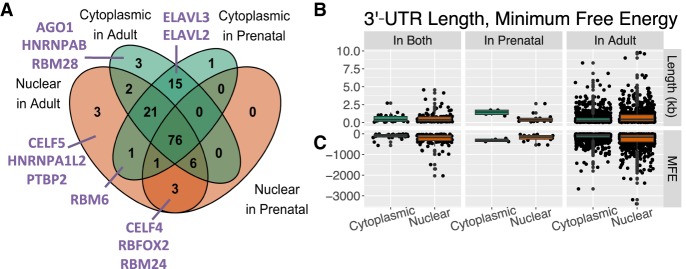
RNA-binding protein motif enrichment, 3′-UTR length, and predicted secondary 3′-UTR structure of fraction-regulated genes. (A) Overlap of RBPs with sequence motifs found (FDR ≤ 0.01) in four groups of genes differentially expressed by fraction measured in adult and prenatal samples (FDR ≤ 0.05). RBPs discussed in the text are listed in purple. (B) Length in kilobases of the highest expressed 3′ UTR for each gene differentially expressed by fraction in both adult and prenatal, only prenatal, or only adult brain. (C) Minimum predicted free energy (MFE) of the secondary structure for the aforementioned 3′ UTRs.

