Figure 7.
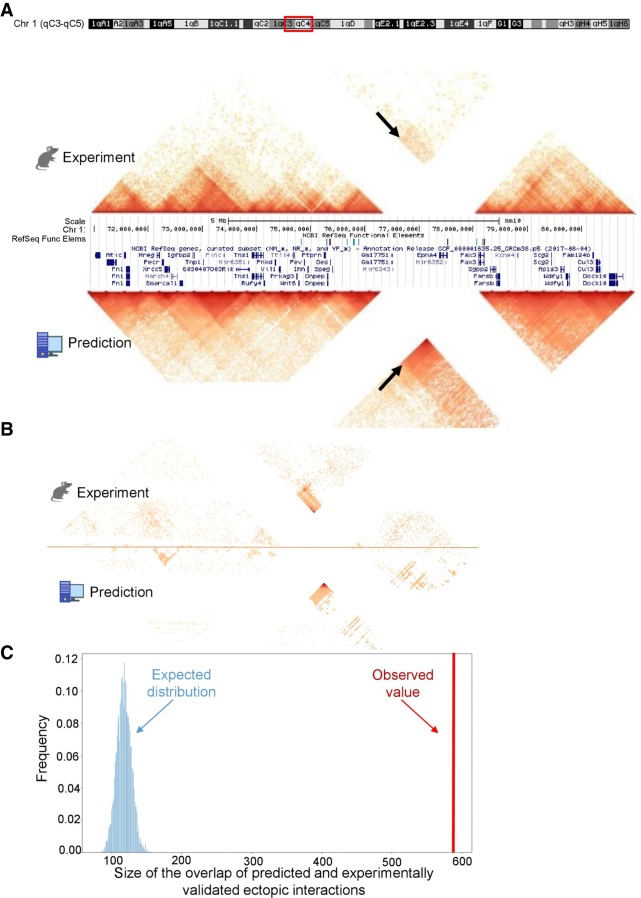
3DPredictor captures three-dimensional organization of rearranged genomic regions. (A) Contact map of mouse DelB locus, carrying homozygous deletion of ∼1.5 Mb, with experimentally measured contacts in the top and 3DPredictor modeling results in the bottom. White lines correspond to contacts of the deleted locus. Note ectopic interactions between Pax3 and Epha4 TADs (indicated by arrows). These ectopic interactions are even more visible in B, where the same region is plotted and only those interactions which differ between WT and DelB by more than three standard deviations are kept. In A, the color indicates contact counts, whereas in B, the color indicates significance of differences between WT and DelB data. (C) Sizes of observed (red vertical bar) and expected (blue bars) overlaps between experimental and predicted ectopic interactions.

