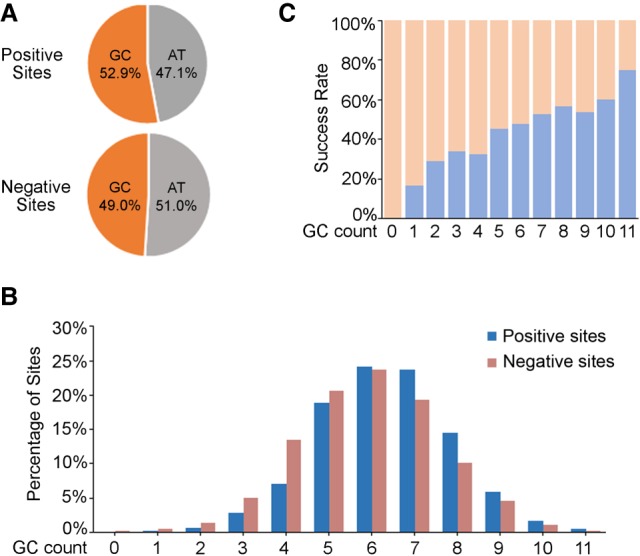
Figure 1.

GC-content distribution in the 12-nt seed sequence of all the tested target sites (including 1086 positive sites and 1191 negative sites). (A) GC percentage of positive and negative target sites at the seed region, respectively. (B) GC percentage distribution of the seed region in all the tested target sites. GC count: number of G or C nucleotides in the 12-nucleotide (nt) seed sequence of the target sites. (C) Correlation of the positive rate of target sites with different GC percentages of the seed region. GC count: number of G or C nucleotides in the 12-nt seed sequence of the target sites.
