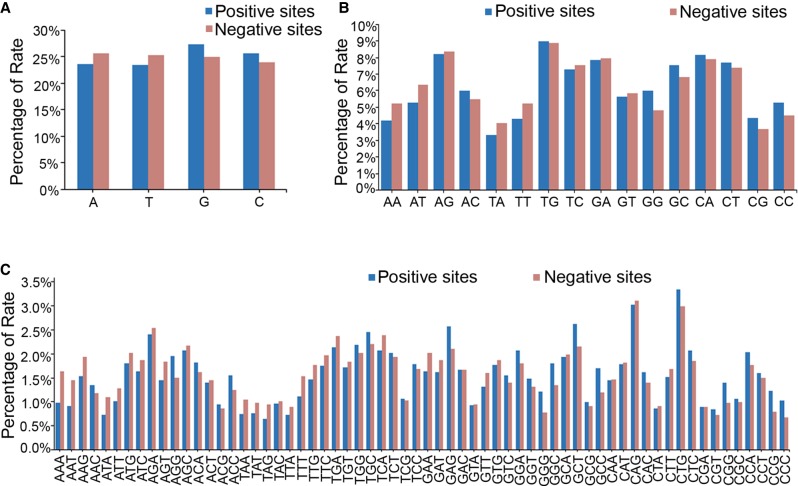
Figure 2.
Distribution of nucleotide motifs in the 12-nt seed region of all the tested target sites. (A) The statistical data showing the distribution of each single nucleotide in the seed region of the target sites. (B) The statistical data showing the distribution of 2-nt motifs in the seed region of the target sites. (C) The statistical data showing the distribution of 3-nt motifs in the seed region of the target sites.

