Figure 4.
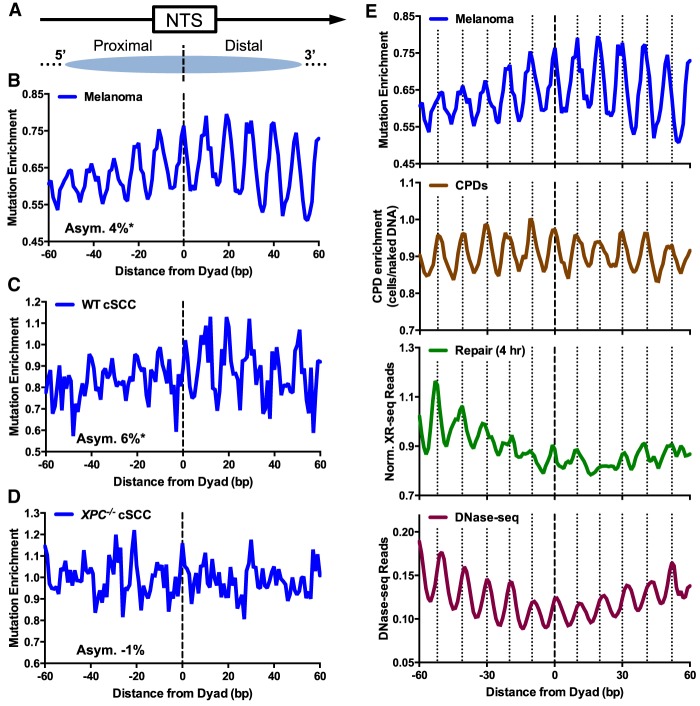
Somatic mutations in skin cancers are asymmetrically distributed in intragenic nucleosomes. (A) Diagram depicting how the NTS associated with human intragenic nucleosomes was oriented in the 5′-to-3′ direction. Arrow indicates the direction of transcription. Dashed line indicates the aligned dyad axes of the intragenic nucleosomes. (B) Enrichment of somatic mutations in 183 melanoma tumors along the NTS was plotted at positions from −60 to +60 bp from dyad axis of intragenic nucleosomes. Mutation enrichment was calculated by dividing the actual density of mutations along the NTS by the expected mutation density, based on the trinucleotide sequence context (Methods). The average relative difference between the mutation enrichment on the 5′ and 3′ sides of the nucleosome dyad was used to quantify the degree of asymmetry (Asym.) in mutagenesis, which is expressed as percent value. (C) Same as B, except for cutaneous squamous cell carcinomas (cSCCs) from NER competent (WT) patients. (D) Same as B, except for cSCCs from GG-NER-deficient patients with mutations in XPC. (E) Comparison of melanoma mutation enrichment among intragenic nucleosomes (top) with CPD enrichment (second from top), normalized XR-seq reads (third from top), and DNase-seq reads (bottom). “Out” rotational settings in the intragenic nucleosomes are indicated with vertical dashed lines. CPD enrichment was calculated from the scaled ratio of CPD lesions in UV-irradiated cells relative to CPD lesions in UV-irradiated naked DNA, using data from Brown et al. (2018) and Mao et al. (2018). Normalized XR-seq data for the 4-h repair time point are same as those depicted in Figure 3B, lower panel. DNase-seq data measure nucleosomal DNA accessibility and were obtained from Degner et al. (2012).

