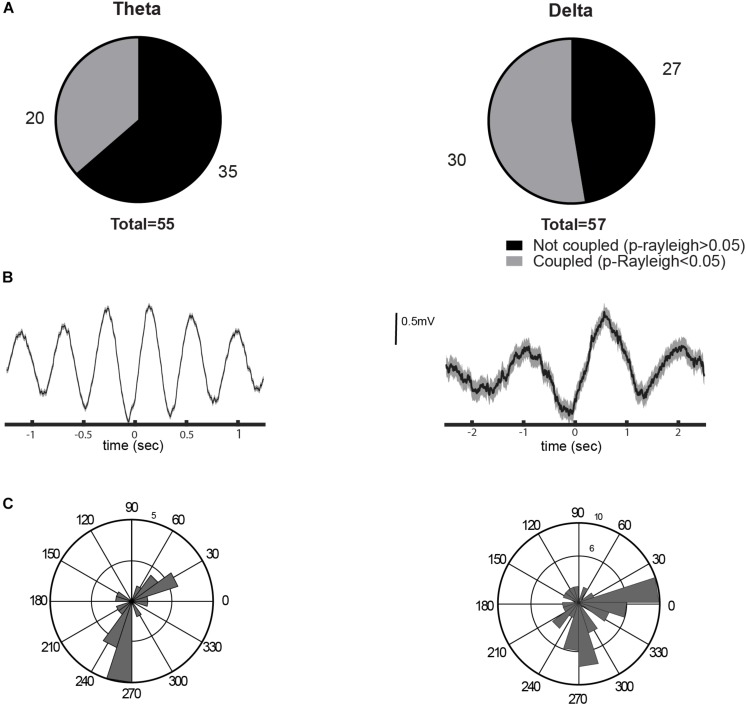
FIGURE 5.
Entrainment of the lateral habenula (LHb) neurons to brain rhythms. (A) Proportion of neurons coupled to theta (left) and delta (right) rhythms. (B) Examples of spike trigger average of a unit entrained by theta or delta oscillation (left and right, respectively). (C) Circular histogram with preferred phases of coupled neurons for each rhythm, to theta on the left and to delta on the right. 0 degree corresponds to the oscillation peak.

