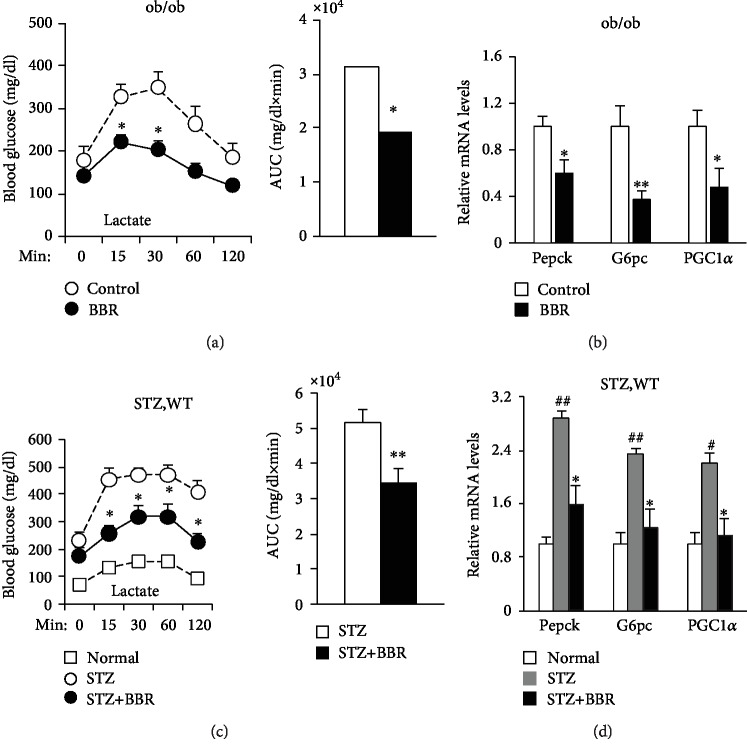
Figure 2.
In vivo regulation of the gluconeogenic program by BBR. Lactate tolerance test in diabetic mice. Fasted mice were injected intraperitoneally with either NaCl or sodium lactate. Blood glucose was measured across time and the AUC data. (a) Lactate tolerance test in ob/ob mice. ∗P < 0.05, compared with the control group (N = 8). (c) Lactate tolerance test in STZ-induced diabetic mice. ∗P < 0.05, ∗∗P < 0.01, compared with the STZ group (N = 7‐9). Quantitative PCR analysis of Pepck, G6pc, and PGC1α mRNA levels in livers from diabetic mice and normalized to 36B4 levels. (b) PCR analysis in ob/ob mice. ∗P < 0.05, ∗∗P < 0.01, compared with the control group (N = 8). (d) PCR analysis in STZ-induced diabetic mice. ∗P < 0.05, compared with the STZ group; #P < 0.05, ##P < 0.01, compared with the normal group (N = 7‐9).

