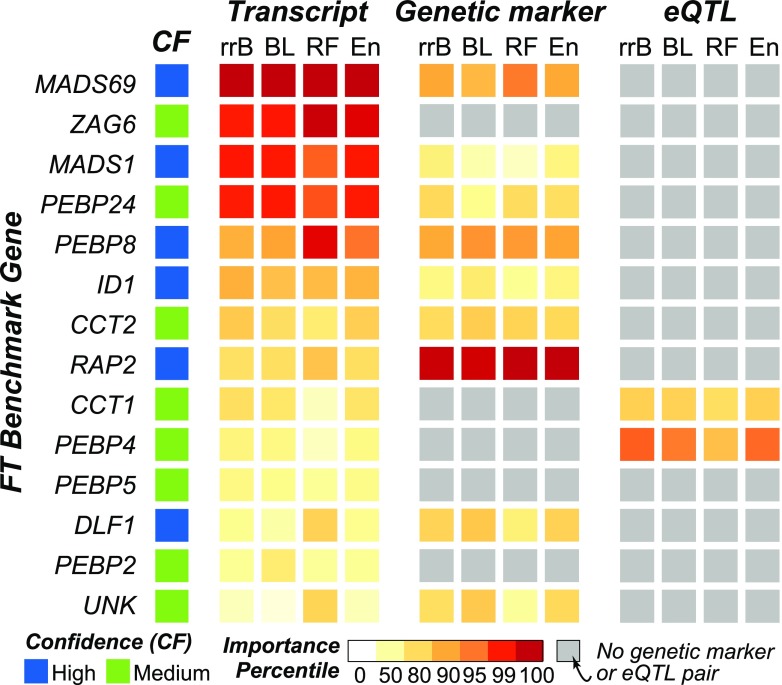
Figure 4.
Comparison of Transcript and Genetic Marker Importance Scores for Benchmark Flowering-Time Genes.
Importance percentile of each transcript and genetic marker pair as determined by each of the four algorithms (x axis) is shown. Genes are sorted based on hierarchical clustering of their importance percentiles. Gray boxes designate benchmark genes that did not have genetic markers within a 40-kb window. Confidence levels (high or medium) were assigned based on the type of evidence available for the benchmark gene (see Methods). rrB, rrBLUP.

