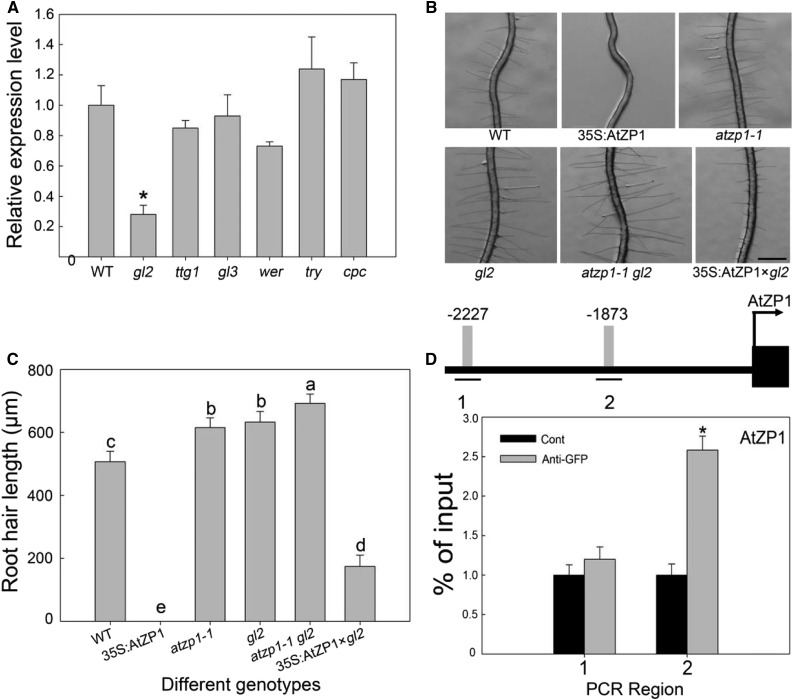
Figure 9.
AtZP1 Is Regulated by GL2.
(A) Expression analysis of AtZP1 in various mutants and the wild type (WT). Three biological replicates were performed. Error bars indicate sd (n = 3). Statistical significance was determined by Student’s t tests. *P < 0.05 represents a significant difference.
(B) Root hair phenotypes of the wild-type (WT), 35S:AtZP1, atzp1-1, gl2, atzp1-1 gl2, and 35S:AtZP1×gl2 plants. Bar = 500 μm.
(C) Mean root hair lengths of the wild-type (WT), 35S:AtZP1, atzp1-1, gl2, atzp1-1 gl2, and 35S:AtZP1×gl2 genotypes. Six biological replicates were performed. Error bars indicate sd (n = 6). Statistical significance was determined by one-way ANOVA, Duncan’s multiple range test. Significant differences at P < 0.01 are represented by different letters (a to e) above the bars.
(D) Schematic diagram of the AtZP1 promoter region (3 kb from the start codon, L1 box sequence TAAATGT [gray bars] and its location [lines marked 1 and 2]) and ChIP-PCR enrichment (fold) of the regions (the ChIP experiment was performed with the wild type [Cont] and ProGL2:GL2:GFP transgenic Arabidopsis). The error bars indicate the ± sds from three biological repeats. The values are relative to each Cont value. *P < 0.05 (Student’s t test) represents significant differences from the control value. Numbers (1 and 2) and lines represent the possible binding sequences of GL2 in the different promoter region of AtZP1. Different bars represent the binding sequence of GL2 at the corresponding position of the AtZP1 promoter, numbers (−2227 and −1873) show the position information of AtZP1 promoter.

