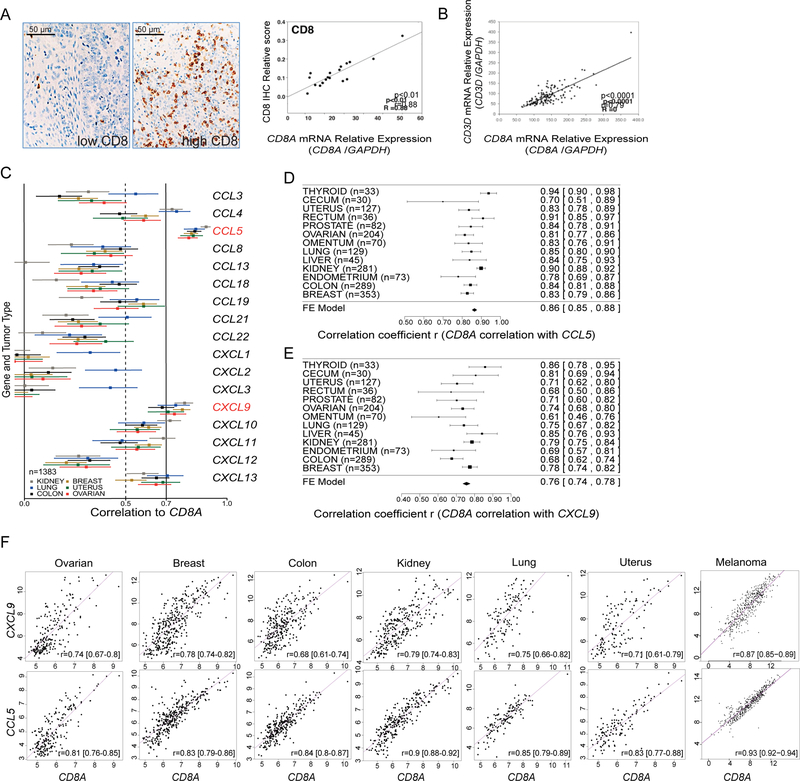
Figure 1. Identification of chemokines correlating with CD8A in solid tumors.
(A) IHC examples of advanced ovarian tumors with low and high levels of CD8+ TILs (left) and Pearson correlation plot of CD8A mRNA and CD8+ TILs in EOC samples (n=19) (right). (B) Pearson correlation plot of expressions of CD8A and CD3D (n=125). (C) Correlation analyses of CD8A expression with that of CCL and CXCL chemokine genes in the ExpO microarray dataset. Estimate (square) in a subset of 6 tumor types was plotted with 95% confidence intervals (CI) (lines) truncated on the left (n=1383). (D-E) Forest plots and meta-analytical estimation of the correlation between expressions of CD8A with CCL5 (D) or with CXCL9 (E) for 13 tumor types (n=1752). Estimates (squares) are drawn in proportion to n with 95% CI (lines). Average correlation r (diamond) to CD8A: r=0.86 and r=0.76, for CCL5 and CXCL9 respectively. (F) Scatterplots showing the range of associations (r) with 95% CI and proportionality of expression levels for CD8A and CCL5 or CXCL9 in seven solid tumor types. All lower bounds being higher than zero indicate highly significant associations. See also Figures S1, S2.

