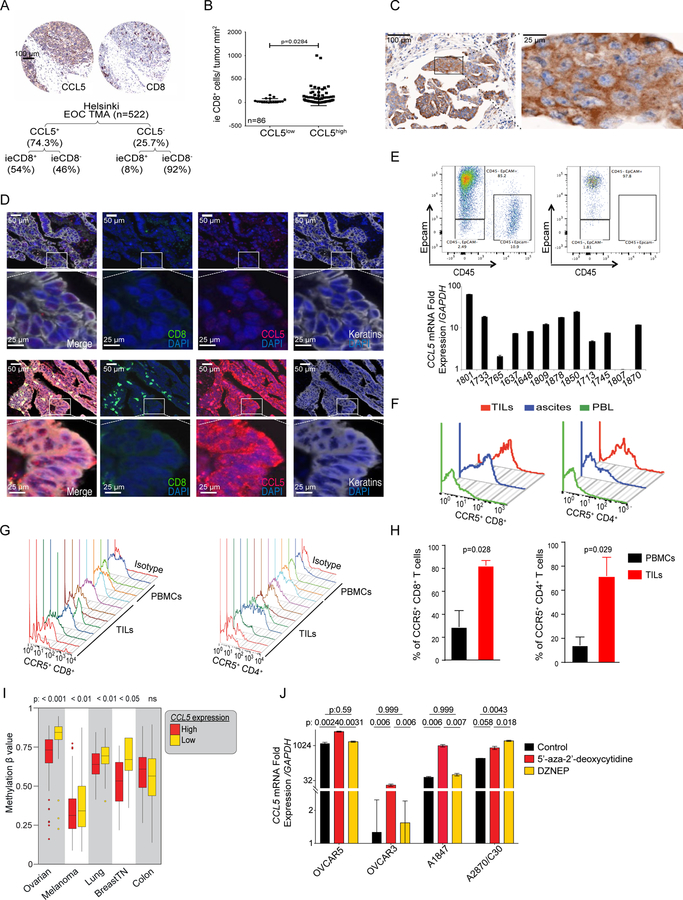
Figure 2. CCL5 is intrinsically expressed by ovarian cancer cells and is associated with CD8+ T cells infiltration in tumors.
(A) Representative IHC images and summary of CCL5 protein expression and ieCD8+ TILs in the Helsinki EOC TMA and comparison of absolute number for CCL5+/− and CD8+/− categories (Fisher’s exact test p=2.2×10⁻¹⁶) (B) Quantification of ieCD8+ TILs in CCL5low and CCL5high tumors (UPenn cohort). P value was calculated with Mann-Whitney test. (C) CCL5 IHC staining in EOC. A tumor islet with cytoplasmic CCL5 is projected. (D) Multispectral immunofluorescence staining of CCL5− (upper) and CCL5+ (lower) EOC cases for CCL5 (red), keratin (grey), and CD8+ (green). (E) Representative FACS dot plot of FACS-sorted Epcam+CD45− ovarian cancer cells before (upper left) and after sorting (upper right) and relative quantification of CCL5 mRNA in FACS-sorted Epcam+CD45− EOC cells (lower bar graph). (F) FACS analysis of CCR5 expression in CD8+ and CD4+ T cells isolated from solid tumor, ascites and matched blood (PBL) of EOC patient. (G) FACS analysis of CCR5 in TILs or PBMCs from EOC patients. (H) Quantification of CCR5 expression in CD8+ and CD4+ T cells from PBMCs or TILs from EOC patients. P values were calculated with unpaired T test. (I) CCL5 methylation β values in CCL5high and CCL5low groups of five tumor types (TCGA datasets). Boxplots represent 25th and 75th percentiles with midline indicating the median; whiskers extend to maximally 1.5 interquartile (IQ) range beyond the box limits. Points indicate values for individual subjects beyond whiskers. (J) CCL5 expression in the indicated ovarian cancer cell lines 72 hr after 5’-aza-2’-deoxycytidine or DZNeP treatment. P values were calculated with unpaired T test. All bar-graph data are presented as mean ± SEM. See also Figure S3.

