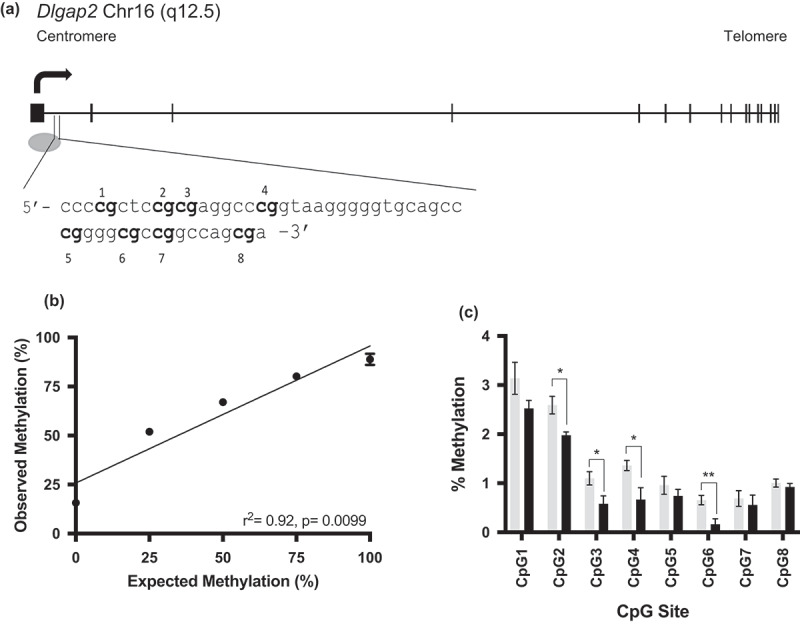
Figure 4.

Rat Dlgap2 gene schematic and pyrosequencing assay validation. (a) A gene schematic of Dlgap2. Exons are represented by the rectangular boxes, while the oval represents a CpG island. The sequence of interest is identified in the inset. (b) Pyrosequencing assay validation performed in triplicate for Dlgap2. Error bars represent the SEM. Error bars not shown had deviations too small for inclusion on the graph. (c) Bisulphite pyrosequencing data from control (gray) or 4mg/kg THC exposed (black) rat sperm for Dlgap2. Shown is the mean +/- SEM for each group. * = p < 0.05; ** = p < 0.01.
