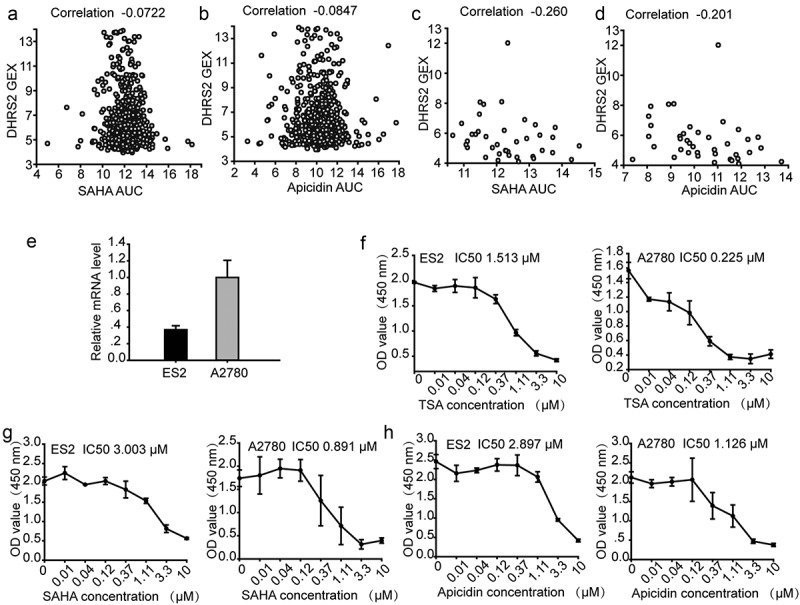
Figure 3.

ES2 cells with decreased DHRS2 mRNA expression are less sensitive to HDACi. A-D. Pearson correlation coefficients for comparisons of HDACi sensitivity data, expressed as the area under concentration-response curves (AUCs), with DHRS2 expression measurements, expressed as log2 robust-multi-array-average values. A. Correlation analysis of SAHA sensitivity and DHRS2 expression in cells from any primary site/subtype (adherent). B. Correlation analysis of apicidin sensitivity and DHRS2 expression in cells from any primary site/subtype (adherent). C. Correlation analysis of SAHA sensitivity and DHRS2 expression in cells from the ovary (adherent). D. Correlation analysis of apicidin sensitivity and apicidin expression in cells from the ovary (adherent). The mRNA levels of DHRS2 in ES2 and A2780 cells. E-H. CCK8 assay showing inhibition of cell growth in ovarian cancer lines (ES2 and A2780) after 48 h of treatment with HDAC inhibitors (TSA, SAHA and apicidin) at various doses (0.01, 0.04, 0.12, 0.37, 1.11, 3.3 and 10 μM). Data represent the mean values (± s.d.) obtained from quadruplicate cultures from three independent experiments.
