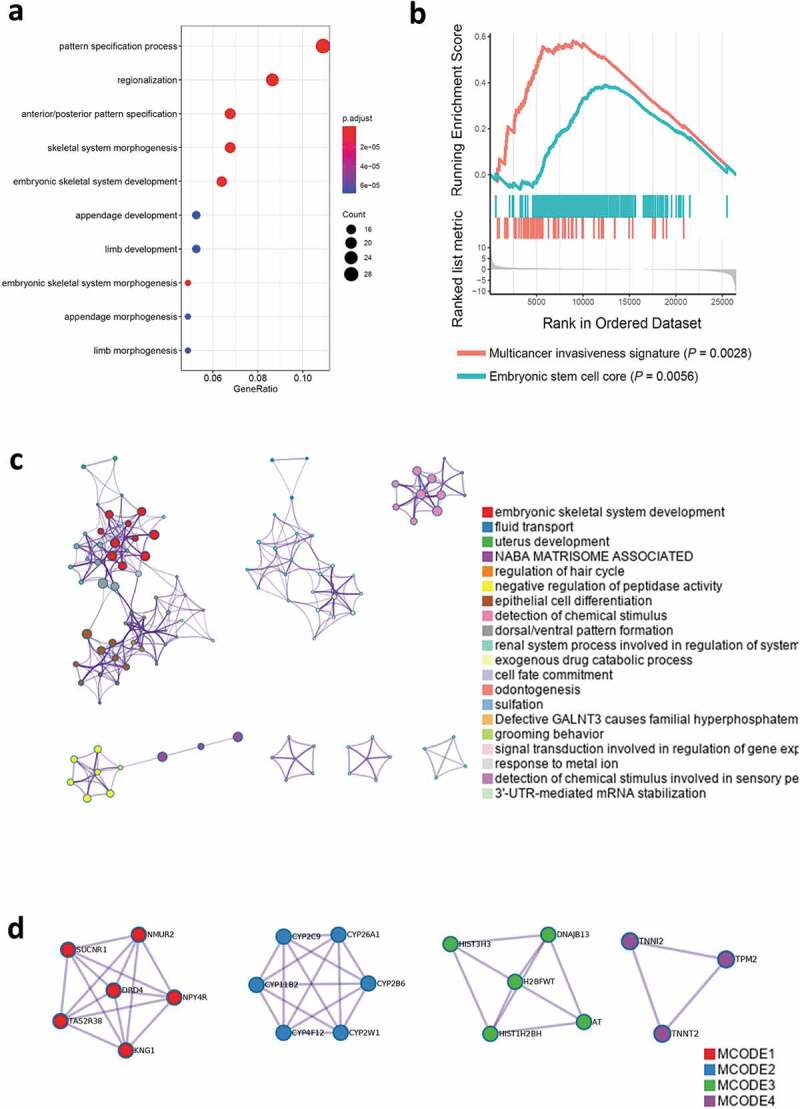
Figure 2.

In the bioinformatics analysis, patients with HOXB5 high expression and low expression showed the differences among the spectra. (a) GO analysis showed that the embryo morphogenesis-associated pathways were enriched. (b) GSEA analysis showed that multicancer invasiveness and embryonic stem cells core were enriched. (c) Metascape analysis enriched embryonic-associated pathways. (d) Three best-scoring terms of MCODE components identified in HOXB5 upregulated genes.
