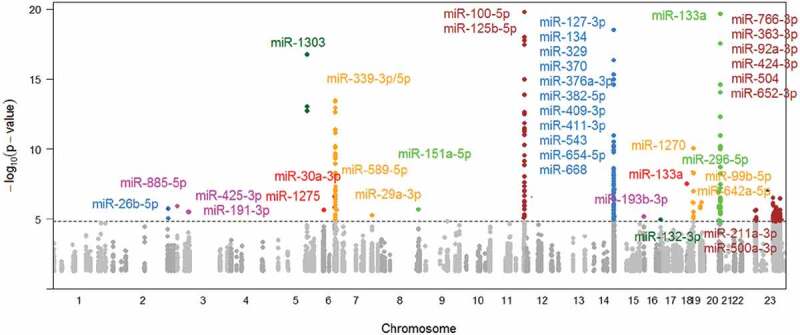
Figure 2.

Manhattan plot of cis-miR-eQTMs.
The grey and dark grey colors denote cis-miR-eQTMs with P < 0.05, and the other colorful dots indicate cis-miR-eQTMs with P < 1.43E-5 (FDR<0.01). The dashed line indicates FDR = 0.01. 15 cis-miR-eQTMs for miR-125b-5p and miR-100-5p in Chromosome 11 and 3 cis-miR-eQTMs for miR-133a in Chromosome 20 were at P < 1E-20 and are not shown in this figure. miR-133a shows in both Chr18 and Chr20.
