
Figure 3.
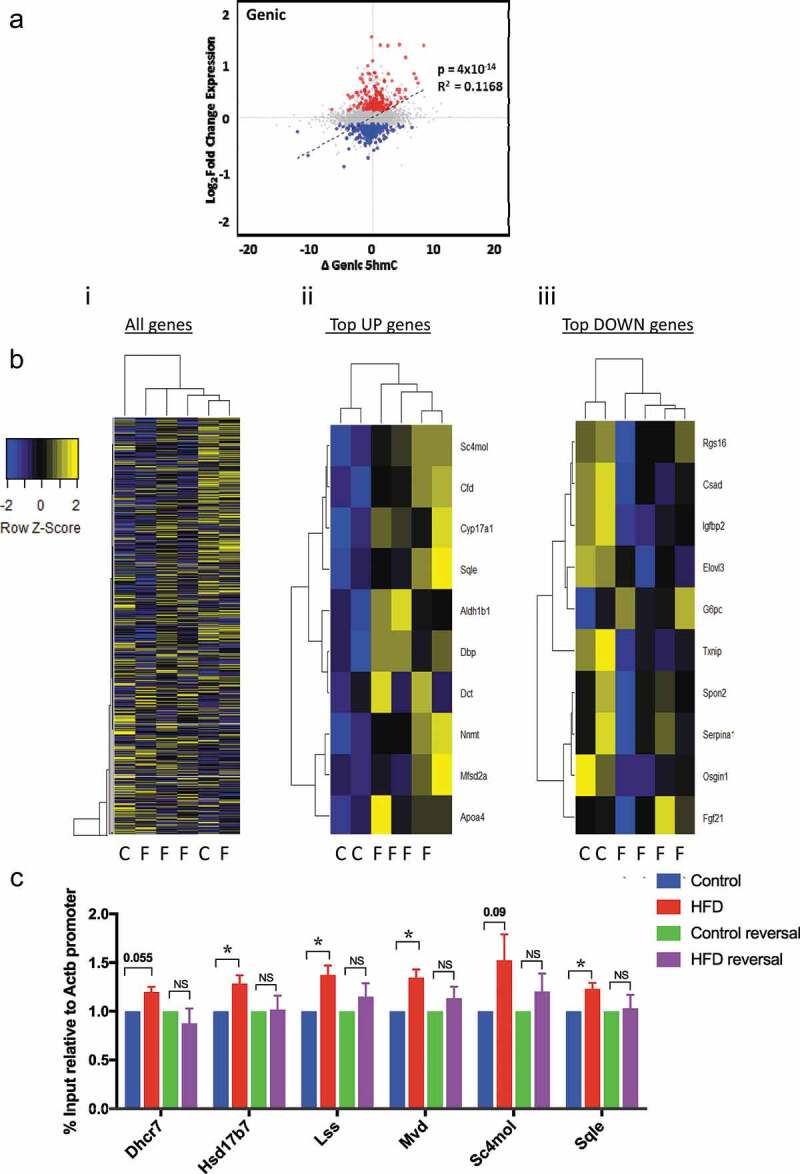
HFD associates with reversible genic 5hmC enrichment at discrete genes with biological relevance. (a) Scatter plot of changes in genic 5hmC versus transcriptional change; Δ5hmC = difference in mean number of normalised reads/150bp window. (b) Z-score heatmap analysis with hierarchical clustering based on average gene body 5hmC for (i) all genes (ii) top 10 induced and (iii) top 10 suppressed genes. (c) hmeDIP-qPCR validation of differentially hydroxymethylated loci and resolution in HFD-reversal group. Data are fold change versus CON analysed by one way Anova with Tukeys test for multiple comparisons * = p < 0.05.