Figure 3.

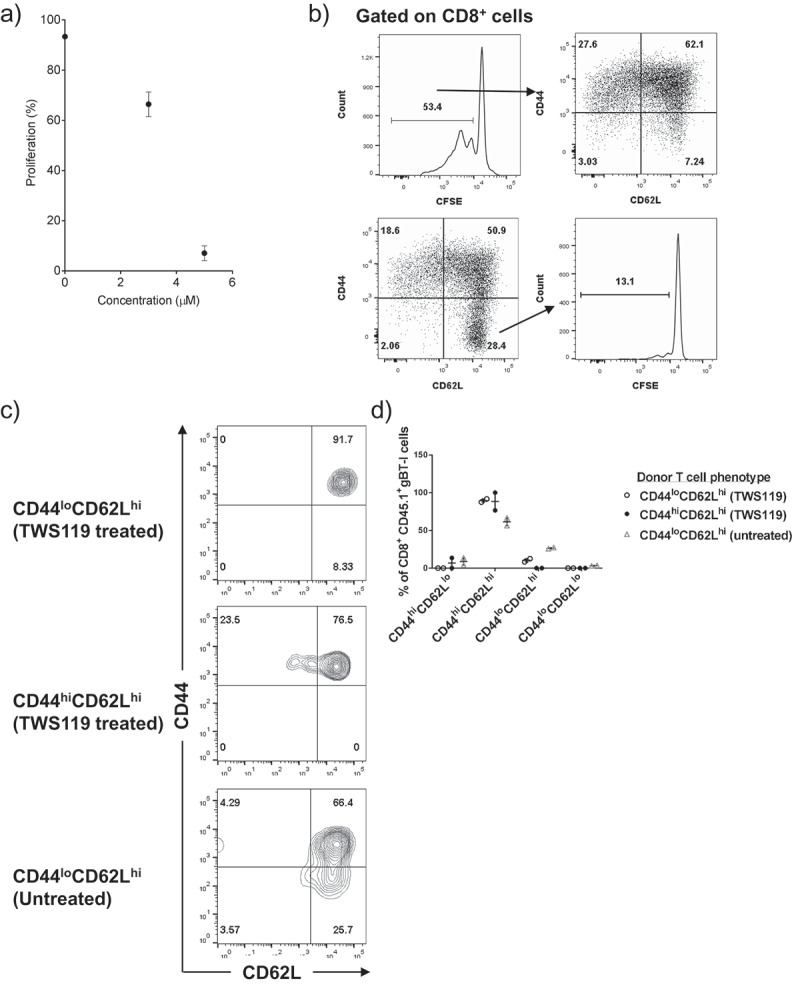
TWS119 treatment failed to generate a Tscm phenotype on gBT-I T cells. (a) Dot plot representing CFSElo proliferating gBT-I T cells in the presence of TWS119, 72 h after activation in a 6-well plate. Each datapoint represents the mean ± SD proliferation. (b) CD44 and CD62L expression of CFSElo T cells post-activation (top row). CFSE profile of CD44loCD62Lhi cells demonstrates that most cells in this population remain naïve (bottom row). Plots are representative for three separate experiments. (c) TWS119-treated cells were sorted into CD44loCD62Lhi, CD44hiCD62Lhi populations, and untreated CD44loCD62Lhi populations (1 x 10^5 cells) were transferred into a lymphodepleted animal. CD44 and CD62L expression on transferred (CD45.1) cells 4 weeks post-transfer are represented as FACS diagrams, and in (d) a dot plot.
