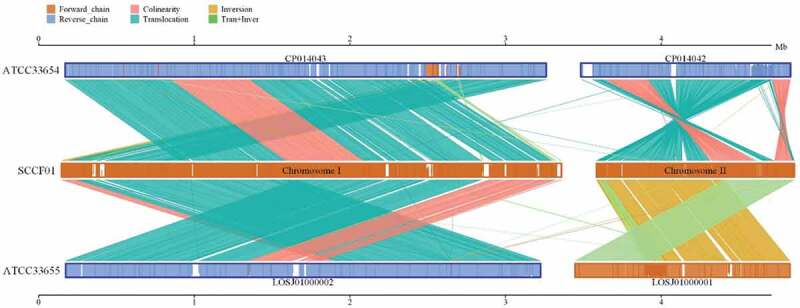
Figure 4.

Linear pairwise comparison of the SCCF01 strain genome.
Note: the upper axis and lower axis are standard strain genome, the medial axis is SCCF01 strain genome, sense strand is shown in the yellow box, antisense strand is shown in blue line, color depth in the box shows the similarity of alignment, full-fit indicates 100% similarity.
