Abstract
Purpose:
To find an efficient method to configure the proton fluence for a commercial proton pencil beam scanning (PBS) treatment planning system (TPS).
Methods:
An in‐water dose kernel was developed to mimic the dose kernel of the pencil beam convolution superposition algorithm, which is part of the commercial proton beam therapy planning software, eclipse™ (Varian Medical Systems, Palo Alto, CA). The field size factor (FSF) was calculated based on the spot profile reconstructed by the in‐house dose kernel. The workflow of using FSFs to find the desirable proton fluence is presented. The in‐house derived spot profile and FSF were validated by a direct comparison with those calculated by the eclipse TPS. The validation included 420 comparisons of the FSFs from 14 proton energies, various field sizes from 2 to 20 cm and various depths from 20% to 80% of proton range.
Results:
The relative in‐water lateral profiles between the in‐house calculation and the eclipse TPS agree very well even at the level of 10−4. The FSFs between the in‐house calculation and the eclipse TPS also agree well. The maximum deviation is within 0.5%, and the standard deviation is less than 0.1%.
Conclusions:
The authors’ method significantly reduced the time to find the desirable proton fluences of the clinical energies. The method is extensively validated and can be applied to any proton centers using PBS and the eclipse TPS.
Keywords: dosimetry, Gaussian distribution, radiation therapy
Keywords: Dose‐volume analysis
Keywords: Radiation therapy, Scintigraphy
Keywords: proton pencil beam scanning, dose kernel, pencil beam convolution superposition, field size factor, double Gaussians
Keywords: Protons, Eclipses, Field size, Halo, Nuclear reaction models, Proton therapy, Medical treatment planning, Selected area electron diffraction, Biomedical modeling
1. INTRODUCTION
Proton therapy centers using the pencil beam scanning (PBS) technique are becoming more prevalent, 1 since PBS allows for the delivery of a more conformal dose to the tumor compared to passive scatter proton therapy. 2 PBS treatment plans may have hundreds to tens of thousands of individual spots. Hence, the accuracy of the dose calculated by the treatment planning system (TPS) relies on the TPS's capability of accurately modeling the dose contribution from each spot. It has been reported that even small errors in characterizing the proton fluence of individual spots far from the central axis may accumulate to a clinically significant dose deviation when the dose contributions from all spots are summed. 3
The fluence‐based dose model is popular for proton dose calculation algorithms, 4 , 5 , 6 where the dose is calculated by convolving the proton fluence with an elemental proton pencil beam dose distribution (dose kernel). It has the advantage that the model is not machine‐specific since the beam‐line‐related components such as proton fluence in air are separated from the proton dose deposition in the medium. 5 The pencil beam convolution superposition (PCS) dose algorithms used in eclipse TPS (Varian Medical Systems, Palo Alto, CA) are fluence based. 7 It is an analytic dose engine that models the in‐air fluence and the dose kernel in the medium using one or multiple Gaussians. 7
Extended low dose tails beyond the Gaussian shapes have been reported by many proton centers. 8 , 9 , 10 , 11 These tails could be classified into two categories, spray and halo, according to their origins. 12 The spray tail is caused by the large angle multiple Coulomb scattering when protons pass through the hardware in the nozzle (such as range shifter, profile monitor chambers, and dose monitor chambers). The halo is the low dose tails from secondary particles due to nuclear reactions in the medium. Low energy protons have more spray tails, while the high energy protons have more nuclear halo tails. Both spray and halo low dose tails affect the proton pencil beam dose calculation. As a consequence of these tail contributions, the measured doses increase with the field sizes, also known as field size factor (FSF). 8 , 9 , 10 , 11
The spray and halo tails make the modeling of the single spot profiles complex. 3 , 13 The eclipse PCS algorithm allows the user to add a 2nd Gaussian to the 1st Gaussian to model the spray tails. In order to save calculation time, 6 the nuclear reaction is approximated by one Gaussian only in the in‐water dose kernel, which leaves the large angle nuclear halo not modeled sufficiently well. It has been reported that this deficiency causes significant output deviations, in particular for high energy proton beams. 8 , 9 However, the eclipse TPS system does not provide the user flexibility to compensate for the deficiency in modeling the halo tail in the dose kernel. The user has to use the 2nd Gaussian originally designed to model the spray tail, to compensate for the deficiency in modeling the halo tail. Since the halo tail is not generated in air but rather in the medium, we call the 2nd Gaussian in air used to compensate for the halo tail the artificially modified proton fluence.
Zhu et al. 3 first presented comprehensive work on how to configure the eclipse PCS algorithm with the double Gaussian model, and showed great improvement in dose calculation by implementing the artificially modified fluence. Direct measurements of tails are very challenging due to the very low signal. 14 FSF is a direct result of tails and is much easier to measure, so it is used to evaluate performance of the artificially modified fluence. The detailed workflow on how to find the most appropriate artificially modified fluence with FSF is described in Sec. 2.B. Since the FSF is a function of the proton energy and depth in the medium, several hundred FSFs must be obtained in order to validate the artificially modified fluences. Usually FSF has to be calculated using the eclipse TPS, so hundreds of calculations in the eclipse TPS are required. In addition, the trial and error method must be used to find the desirable fluence parameters, 3 which is very time consuming. Therefore, the procedure to configure the fluence parameters in the eclipse TPS is a daunting task if all the dose calculations have to be manually performed within eclipse.
In this work, we propose a very efficient method to configure the artificially modified fluence in the eclipse TPS for the proton PCS algorithm. The aim is to establish a generic method that is applicable to any proton PBS practice using the eclipse TPS. The rest of the paper is organized as follows. In Sec. 2, we present how to implement an in‐house eclipse proton PCS dose kernel and calculate the FSF using this code. Then we validate the in‐house dose kernel and FSF calculations. In Sec. 3, the validation results are presented. The discussions and conclusions are included in Secs. 4 and 5, respectively. All the formulas for the eclipse dose kernel are included in the Appendix, which will benefit any interested readers to incorporate our method for solving similar problems.
2. METHODS AND MATERIALS
2.A. PCS algorithm in eclipse TPS
In eclipse, the proton PCS algorithm (algV13.6.23) calculates the dose by convolving the proton fluence , with the proton dose kernel, ,
| (1) |
where d is the depth in medium and z is the distance from the isocenter. The d and z are not independent (z = SAD − SSD − d).
The dose kernel is the 3D dose distribution of an infinitesimal pencil beam of protons. It is further split into four parts: the contributions from the primary protons, secondary protons, recoil protons, and recoil particles. 7 For each particle, one or more Gaussians are used to describe the dose kernel. One Gaussian is used to model the secondary protons generated by the nuclear reaction, and the extended halo is ignored to save computation time. 6
Figure 1 shows the measured FSF (blue crosses) and the FSF calculated by the eclipse PCS algorithm (V13.6.23) using a single Gaussian model (black circles), for a quasi‐monoenergetic proton beam of energy 205.3 MeV at a depth of 15.6 cm. For an energy of 205.3 MeV, spray contributions are negligible, however nuclear halo is non‐negligible. The large difference of the FSF shown in Fig. 1, in particular for the small field sizes, is mainly due to the imperfectly modeling of nuclear halo in the eclipse dose kernel.
Figure 1.
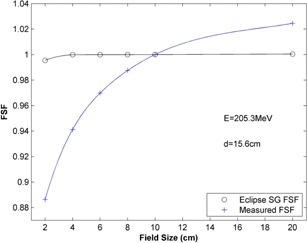
Comparison of FSFs between measurement (blue crosses) and calculation from the eclipse TPS (black circles). The FSFs correspond to the proton energy of 205.3 MeV and the depth of 15.6 cm.
The large FSF deviation in Fig. 1 clearly shows the deficiency of the dose kernel in the PCS algorithm. The dose kernel is hardcoded in the eclipse TPS, which thus cannot be modified by the user. However, the eclipse TPS provides an optional two Gaussian model to model the proton fluence, which is designed to model the spray tail. In order to compensate for the deficiency of the dose kernel, we have artificially modified the 2nd Gaussian to make it not only account for the spray tail, but also the halo tail.
With the double Gaussian fluence model, the proton distribution for a beam spot centered at (xm, ym) may be described as follows: 3
| (2) |
where is the maximum fluence of the spot centered at (xm, ym), is the weight of the 2nd Gaussian function, and σ 1(Ek, z) and σ 2(Ek, z) are the standard deviations of the 1st and 2nd Gaussians, respectively. As shown in Eq. (2), configuring the artificially modified fluence is to find the best parameters of , σ 1(Ek, z) and σ 2(Ek, z).
2.B. Procedure to configure the artificially modified fluence
How to get the most optimal proton fluence is not well‐established. Zhu et al. 3 used the trial and error method. An initial guess of the artificially modified parameters for the proton fluence (i.e., σ 1, σ 2, and w 2) is input into the eclipse TPS. Then the square fields with evenly distributed single energy proton spots are generated in the eclipse TPS and the doses at the center of the square fields are calculated. FSFs for these square fields are derived and compared with the measured FSFs. If the agreement between the eclipse TPS and the measurements are not satisfactory (for instance >±2%), a new set of artificially modified parameters is used to generate the new FSFs. The entire process continues until a satisfactory artificially modified fluence is found.
The FSF varies with the proton energy, the depth in medium, and the SSD. Hundreds of dose calculations have to be performed in the eclipse TPS for the selected field sizes (usually 2–20 cm) and energies (usually a subset of 10–20 energies from all available energies). These calculations have to be done manually within the eclipse TPS. Moreover, the number of repeats in the trial and error loop is unknown. Therefore, configuring the artificially modified fluence requires an intractably large number of calculations in the eclipse TPS.
2.C. An efficient method to create the artificially modified proton fluence
The bottleneck in the process of configuring the artificially modified fluence is due to the fact that hundreds of dose calculations have to go through the eclipse TPS manually. The key to make this process efficient is to automate dose calculations outside the eclipse TPS. According to Eq. (2), the dose kernel of the eclipse PCS algorithm needs to be reproduced to move the time consuming dose calculation outside of the eclipse TPS. We developed an in‐house software to mimic the dose kernel of eclipse and derive FSFs. As a result, the entire process can be automated and completed without going through the eclipse TPS, which will save time and make the whole process efficient.
2.C.1. Implementation of the dose kernel
The dose kernel was generated according to the eclipse algorithm manual 7 and the literature. 6 , 15 , 16 The dose kernel has the components of the absolute dose along the depth and the scatter kernel in the lateral dimensions. Since the FSF is a relative quantity, we can ignore the absolute dose component. Thus, the dose kernel is simplified to the scatter kernel in this paper. In the eclipse PCS algorithm, the particles are separated into primary protons, secondary protons, recoil protons, and heavy recoil particles. The lateral extension of the recoil protons is taken to be identical to that of the primary protons and the lateral extension of the heavy recoil particles is taken to be the same as for the secondary protons. Therefore, the overall lateral extension (scatter kernel) is a weighted sum of the lateral extensions for all above particles,
| (3) |
where w pp, w rp, w sp and w rh are the weights of primary protons, recoil protons, secondary protons, and heavy recoil particles, respectively. The weight of each class of particles (wx) is the ratio of the integrated depth dose (IDDx) of that particle to the total IDD,
| (4) |
The complete set of formulas for the lateral scatter and IDD for all related particles are included in the Appendix. Although the main reference to reconstruct the dose kernel is the eclipse algorithm manual, 7 we cross checked the formulas in the eclipse manual with those presented in the literature. 6 , 15 , 16 We found some discrepancies among the references. First, (the standard deviation of 2D Gaussian) and (the standard deviation of 1D Gaussian) are preferably selected by different groups to represent spot size, which causes inconsistency even after applying the conversion of to . is used throughout this paper as we follow the convention of the eclipse manual. Second, a few inaccuracies in the eclipse manual were identified, which are explicitly highlighted in the Appendix.
2.C.2. Field size factor calculation
After the dose kernel is reconstructed, we can obtain spot profiles in the medium, by using Eq. (1) (i.e., spot fluence convolves with the dose kernel). To note, the used here is not the absolute dose as the scatter kernel in Eq. (3) is used for convolution. The dose for a given square field can be derived by a sum of contributions from all spots in that field. For any field size (FS) and spot spacing (SS) defined at the isocenter plane, the output factor D (FS) at the center of the field is
| (5) |
where , , . VSADx and VSADy are the virtual SAD in x, y directions, respectively. and are the projected spot spacing at the non‐isocenter plane in x, y directions, respectively. After the doses for all square fields are calculated, the FSFs are obtained by normalizing to the field size of 10 × 10 cm, FSF = D(FS)/D(FS = 10).
2.C.3. Validation of dose kernel and FSF
The dose kernel used in the eclipse TPS cannot be extracted, making a direct comparison impossible. To validate that the in‐house dose kernel can reproduce the results obtained from the eclipse TPS, the same set of artificially modified parameters (σ 1, σ 2, and w 2) is used to generate the proton fluence, according to Eq. (2). The in‐water profiles of a single pencil beam spot were generated by the eclipse TPS (V13.6.23) and the in‐house code. Since the same artificially modified parameters shall generate the same fluence, the difference of the in‐water profiles between the eclipse TPS and the in‐house method directly represents the difference of the dose kernel of the eclipse TPS and the in‐house method. The spot profiles of 14 energies sampling from the highest (228.8 MeV) to the lowest energy (71.3 MeV) of our proton system were generated.
The in‐house FSFs were calculated using Eq. (5). The doses of different field sizes were also calculated in the eclipse TPS (V13.6.23), and then the FSFs were derived. In order to get homogenous doses for all depths, a small spot spacing of 2.5 mm was used for all field sizes. The FSFs for all 14 energies were calculated for various field sizes from 2 to 20 cm and depths in water from 20% to 80% of ranges. A total of 420 FSFs were calculated by the in‐house method and compared with those obtained from the eclipse TPS.
3. RESULTS
3.A. In‐water profile comparison
Figure 2 shows the in‐air double Gaussian fluences [green dashed lines, generated by Eq. (2)], the dose kernels [blue lines, generated by Eq. (3)], and the in‐water profiles calculated by the eclipse TPS (red dotted lines) and the in‐house method (black dotted‐dashed lines). The in‐water profiles are generated by convolving the in‐air double Gaussian fluence with the dose kernel, according to Eq. (1). The curves shown in Fig. 2(a) are from the energy of 228.8 MeV and at the depth of 25 cm, with σ 1 = 2.5 mm, σ 2 = 33 mm, and w 2 = 0.1. The curves in the Fig. 2(b) are from the energy of 144.8 MeV and at the depth of 11 cm, with σ 1 = 3.0 mm, σ 2 = 13.2 mm, and w 2 = 0.08. The values of σ 1 are the in air spot size of our proton system, and the values of σ 2 and w 2 are the artificially modified parameters in the double Gaussian model. All the spot sizes σ 1 and σ 2 are defined at the isocenter. The depths shown in Fig. 2 are at about 75% of the ranges, at which the protons have gone through enough scattering but still have non‐negligible nuclear halo. Figure 2 shows a near perfect match between the eclipse TPS and the in‐house method, even to the order of 10−4. This clearly indicates that the in‐house dose kernel accurately reproduces the dose kernel used in the eclipse TPS.
Figure 2.
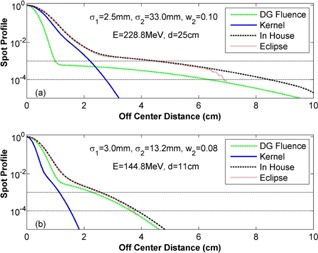
Comparisons of in‐water profiles generated by the eclipse TPS (red dotted lines) and the in‐house method (black dashed lines). The in‐air double Gaussian fluence (green dashed lines) and the convolution kernel (blue lines) that were used to generate the in‐water profiles are also displayed. The curves shown in (a) are for an energy of 228.8 MeV and at a depth of 25 cm, with σ 1 = 2.5 mm, σ 2 = 33 mm, and w 2 = 0.1. The curves shown in (b) are for an energy of 144.8 MeV and at a depth of 11 cm, with σ 1 = 3.0 mm, σ 2 = 13.2 mm, and w 2 = 0.08.
3.B. Field size factor validations
The FSFs of the above profiles were calculated for field sizes ranging from 2 to 20 cm, with a spot spacing of 2.5 mm. As shown in Fig. 3, the FSFs are nearly identical between the eclipse TPS (red circles) and the in‐house method (blue crosses), with a maximum deviation 0.13% at the smallest field size (2 cm). Figure 4 shows a dataset of 420 FSF comparisons from combinations of 14 proton energies, 6 field sizes (2–20 cm), and 5 depths (from 20% to 80% of ranges). As shown in Fig. 4, the maximum deviation is less than 0.5%, and the standard deviation is less than 0.09%. The small deviations shown in Figs. 3 and 4 indicate that the in‐house method accurately reproduces the FSFs of the eclipse TPS.
Figure 3.
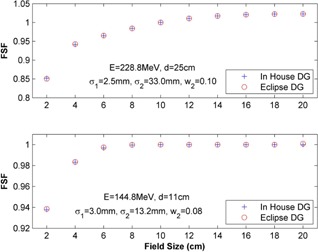
Comparisons of FSFs generated by the eclipse TPS (red circles) and the in‐house method (blue crosses). The FSFs for field sizes from 2 to 20 cm are calculated using the spot profiles in Fig. 2, with the 2.5 mm spot spacing.
Figure 4.
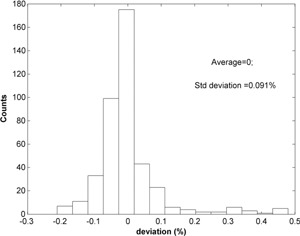
The histogram of the FSF difference between the eclipse TPS and the in‐house method. The total of 420 comparisons includes 14 proton energies sampled from the highest (228.8 MeV) to the lowest proton energies (71.3 MeV), 6 field sizes from 2 to 20 cm, and 5 depths in the water from 20% to 80% of the proton range.
4. DISCUSSION
Figure 1 shows the significant dose deficiency of the eclipse PCS algorithm because of the underestimation of the nuclear halo. We have to artificially modify the 2nd Gaussian, originally designed to model in‐air low dose tails to compensate for the in‐water dose kernel deficiency in the eclipse TPS. However, the procedure to find the most appropriate artificially modified fluence parameters is tedious if all dose calculations have to be done manually using the eclipse TPS. Without a dose kernel improvement implemented by the vendor following the problem proposed by Zhu et al., 3 artificially modifying the in‐air fluence is an efficient method to compensate for the in‐water dose kernel deficiency.
We developed our own in‐water dose kernel of the eclipse proton PCS algorithm, and calculated the FSF using the in‐house method. Both the in‐house dose kernel and the calculated FSFs were validated. The comparisons of in‐water lateral spot profiles in Fig. 2 show the consistency between the eclipse TPS and the in‐house method. Note that the in‐water lateral spot profile derived from the dose kernel in the Fig. 2(a) is wider than the in‐air fluence. This is due to the deep penetration of the high energy protons resulting in a large amount of scattering in the dose kernel. As a consequence, the in‐water profile is mainly determined by the dose kernel. Any differences of dose kernels between the in‐house method and eclipse TPS would be manifested by differences of the in‐water profiles. The agreement in profiles in Fig. 2 extends to the order of 10−4, which suggests that the in‐house dose kernel is indeed a good replica of the eclipse TPS dose kernel. With highly conformal spot profile, it is not surprising to see the excellent consistency of FSFs shown in Figs. 3 and 4.
After the in‐house dose kernel and the FSF calculations are validated, it is possible to find the best artificially modified fluence parameter completely outside of the eclipse TPS. The whole process may be automated to substantially improve the efficiency. For example, it takes less than a second to get the FSFs in Fig. 3 using the in‐house method, compared to about an hour to calculate the dose and derive FSFs using the eclipse TPS, which does not include the additional time to prepare the plan files in the eclipse TPS which is not needed for the in‐house method. The time difference in obtaining data in Fig. 4 between the in‐house method and the eclipse TPS is ∼10 s (CPU time) vs ∼8 h (operator time). Since the FSF is a function of proton energy, depth, and SSD, it would take an enormous amount of time to manually test all these combinations comprehensively. In reality, only a limited number of trials can be performed using the eclipse TPS, which may not be sufficient to find the optimal results. The in‐house method, however, can run hundreds of these combinations in less than 10 min. Therefore, it can save a significant amount of time, and also generate a better fluence optimization.
The method proposed in this paper is a generic method that is applicable to any PBS proton beam therapy practices that use the eclipse TPS with the PCS dose calculation algorithm. The method also works for machines with range shifters, which have a fixed distance from the isocenter. The only modifications are that the proton fluence needs to be replaced by the new fluence at the downstream side of the range shifter, and the proton energy needs to be adjusted accordingly. In particular, we have explicitly written all the formulas in the context and the Appendix. This includes the correction of the typos and the validation of the formulas. We hope this will benefit our community who need to solve the same problem.
Although the method is generic, the formulas listed in this paper may not be. The formulas used to implement the in‐house dose kernel are strongly related to the proton dose calculation algorithm used in the eclipse TPS. If a different version of the eclipse TPS is used, users should adjust the formulas according to the specific algorithm release.
5. CONCLUSION
In this paper we proposed an efficient method to find artificially modified proton fluence parameters to accurately configure the PCS algorithm in eclipse. We implemented an in‐house dose kernel of the eclipse TPS and calculated the FSF using this software. The method was validated and excellent agreement was found with the eclipse TPS. The new method can save a substantial amount of time in finding the desirable proton fluence parameters, and works for any proton centers using the eclipse proton PCS algorithm.
ACKNOWLEDGMENTS
The authors wish to thank Dr. Waldemar Ulmer for providing references for and guidance on the eclipse analytical model. The authors want to thank dosimetrist colleagues Shawn M. Korte, James P. Archuleta, and Corbin A. Stefan for calculating the 420 FSFs in the eclipse TPS.
CONFLICT OF INTEREST DISCLOSURE
The authors have no COI to report.
FORMULAS FOR ECLIPSE PCS SCATTER KERNEL
All the formulas are included in the appendix. The grey boxes highlight the typos in the manual of eclipse proton algorithm.
1. Lateral extension of the primary protons
The lateral scatter of the primary protons is approximated by two Gaussians τ lat and τ lat,LA with the 2nd Gaussian τ lat,LA for large‐angle scattering. The lateral scatter kernel describes the scatter intensity at radius r from the primary protons and depth z in the phantom,
The contribution of the main Gaussian is C 0 = 0.96. The scatter parameters τ lat and τ lat,LA are calculated as follows:
where 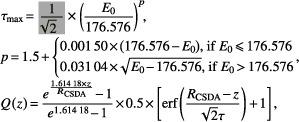 , , and τin is the Bragg peak broadening caused by the finite energy spread of the incident protons and
2. Lateral extension of the secondary protons
The lateral scatter of the secondary protons is described by
where
τ
max and Q(Z) are the same as previously defined for primary protons. τ
heavy(Ez) is described by  where Ez is the proton energy for the local depth z.
3. IDD of all particles
The IDD of the primary protons that in eclipse is described as
The scaling factor N abs that in the eclipse algorithm manual is removed in the above equation because we only need the ratio of the IDDs for this work,
where ,
where , C 1 = 5.7088 − 0.004 629 7 × E 0, C 2 = 0.4862 + 0.0014 × E 0, C 3 = 2.0796 − 0.002 080 6 × E 0, C 4 = 0.8106 − 0.0014 × E 0, k 1 = 9.8492 + 0.001 748 3 × E 0, z max = R CSDA + ε, and
The Landau correction terms ILan1 and ILan2 are described as follows:  where
where 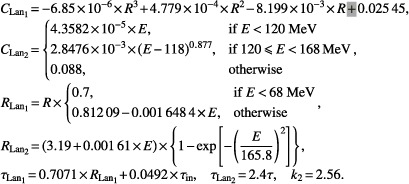 z′ = z − z
NET, where z
NET is the water‐equivalent thickness of the material in the nozzle. For our proton system, z
NET = 0.21 cm. Similarly, R = R
CSDA − z
NET, and E is the residual energy at nozzle exit.
The IDD of the secondary protons is described as
where , τLan1 = 0.7071 × R Lan1 + 0.0492 × τ in + τ heavy, and zs = z + z shift with
The IDD of the recoil protons is described as
The IDD of the heavy recoil particles is described as
where
4. Other parameters
In order to get the dose convolution kernel, one still needs a few more parameters. The first one is the τ in, which is the only free parameter in the above equations. It can be derived from the measured IDD, and the Eclispe TPS did this in the beam data calculation. The τ in values for our synchrotron based proton system are 0.33 and 1.56 mm for the lowest energy (71.3 MeV) and highest energy (228.8 MeV), respectively. Larger τ in values are expected for a cyclotron based proton system. The 2nd parameter needed is the relationships between the range (R CSDA) and initial energy (E 0), and the depth (z) and the residual energy (Ez). A lookup table R CSDA (E 0) or E 0(R CSDA) can be established from the NIST website, and the residual energy Ez = E 0(R CSDA − z).
REFERENCES
- 1.Particle Therapy Co‐Operative Group, Particle therapy facilities in operation: Information about technical equipment and patient statistics, Particle Therapy Co‐Operative Group, 2016, Retrieved from http://ptcog.ch/index.php/facilities-in-operation.
- 2. Lomax A. J., Bohringer T., Bolsi A., Coray D., Emert F., Goitein G., Jermann M., Lin S., Pedroni E., Rutz H., Stadelmann O., Timmermann B., Verwey J., and Weber D. C., “Treatment planning and verification of proton therapy using spot scanning: Initial experiences,” Med. Phys. 31, 3150–3157 (2004). 10.1118/1.1779371 [DOI] [PubMed] [Google Scholar]
- 3. Zhu X. R., Poenisch F., Lii M., Sawakuchi G. O., Titt U., Bues M., Song X., Zhang X., Li Y., Ciangaru G., Li H., Taylor M. B., Suzuki K., Mohan R., Gillin M. T., and Sahoo N., “Commissioning dose computation models for spot scanning proton beams in water for a commercially available treatment planning system,” Med. Phys. 40, 041723 (15pp.) (2013). 10.1118/1.4798229 [DOI] [PMC free article] [PubMed] [Google Scholar]
- 4. Schaffner B., Pedroni E., and Lomax A., “Dose calculation models for proton treatment planning using a dynamic beam delivery system: An attempt to include density heterogeneity effects in the analytical dose calculation,” Phys. Med. Biol. 44, 27–41 (1999). 10.1088/0031-9155/44/1/004 [DOI] [PubMed] [Google Scholar]
- 5. Schaffner B., “Proton dose calculation based on in‐air fluence measurements,” Phys. Med. Biol. 53, 1545–1562 (2008). 10.1088/0031-9155/53/6/003 [DOI] [PubMed] [Google Scholar]
- 6. Ulmer W. and Matsinos E., “Theoretical methods for the calculation of Bragg curves and 3D distributions of proton beams,” Eur. Phys. J.: Spec. Top. 190, 1–81 (2010). 10.1140/epjst/e2010-01335-7 [DOI] [Google Scholar]
- 7. Varian, Proton Algorithm Reference Guide (Varian Medical Systems, Palo Alto, CA, 2015). [Google Scholar]
- 8. Pedroni E., Scheib S., Bohringer T., Coray A., Grossmann M., Lin S., and Lomax A., “Experimental characterization and physical modelling of the dose distribution of scanned proton pencil beams,” Phys. Med. Biol. 50, 541–561 (2005). 10.1088/0031-9155/50/3/011 [DOI] [PubMed] [Google Scholar]
- 9. Sawakuchi G. O., Zhu X. R., Poenisch F., Suzuki K., Ciangaru G., Titt U., Anand A., Mohan R., Gillin M. T., and Sahoo N., “Experimental characterization of the low‐dose envelope of spot scanning proton beams,” Phys. Med. Biol. 55, 3467–3478 (2010). 10.1088/0031-9155/55/12/013 [DOI] [PubMed] [Google Scholar]
- 10. Schwaab J., Brons S., Fieres J., and Parodi K., “Experimental characterization of lateral profiles of scanned proton and carbon ion pencil beams for improved beam models in ion therapy treatment planning,” Phys. Med. Biol. 56, 7813–7827 (2011). 10.1088/0031-9155/56/24/009 [DOI] [PubMed] [Google Scholar]
- 11. Lin L., Ainsley C. G., and McDonough J. E., “Experimental characterization of two‐dimensional pencil beam scanning proton spot profiles,” Phys. Med. Biol. 58, 6193–6204 (2013). 10.1088/0031-9155/58/17/6193 [DOI] [PubMed] [Google Scholar]
- 12. Gottschalk B., Cascio E. W., Daartz J., and Wagner M. S., “On the nuclear halo of a proton pencil beam stopping in water,” Phys. Med. Biol. 60, 5627–5654 (2015). 10.1088/0031-9155/60/14/5627 [DOI] [PubMed] [Google Scholar]
- 13. Li Y., Zhu R. X., Sahoo N., Anand A., and Zhang X., “Beyond Gaussians: A study of single‐spot modeling for scanning proton dose calculation,” Phys. Med. Biol. 57, 983–997 (2012). 10.1088/0031-9155/57/4/983 [DOI] [PMC free article] [PubMed] [Google Scholar]
- 14. Anand A., Sahoo N., Zhu X. R., Sawakuchi G. O., Poenisch F., Amos R. A., Ciangaru G., Titt U., Suzuki K., Mohan R., and Gillin M. T., “A procedure to determine the planar integral spot dose values of proton pencil beam spots,” Med. Phys. 39, 891–900 (2012). 10.1118/1.3671891 [DOI] [PMC free article] [PubMed] [Google Scholar]
- 15. Ulmer W. and Schaffner B., “Foundation of an analytical proton beamlet model for inclusion in a general proton dose calculation system,” Radiat. Phys. Chem. 80, 378–389 (2011). 10.1016/j.radphyschem.2010.10.006 [DOI] [Google Scholar]
- 16. Ulmer W. and Schaffner B., “Laboratory report (LR) to the paper Foundation of an analytical proton beamlet model for inclusion in a general proton dose calculation system,” e‐print arXiv:1009.21872010.


