
Figure 2.
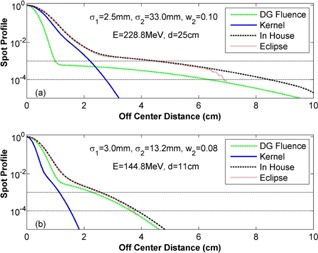
Comparisons of in‐water profiles generated by the eclipse TPS (red dotted lines) and the in‐house method (black dashed lines). The in‐air double Gaussian fluence (green dashed lines) and the convolution kernel (blue lines) that were used to generate the in‐water profiles are also displayed. The curves shown in (a) are for an energy of 228.8 MeV and at a depth of 25 cm, with σ 1 = 2.5 mm, σ 2 = 33 mm, and w 2 = 0.1. The curves shown in (b) are for an energy of 144.8 MeV and at a depth of 11 cm, with σ 1 = 3.0 mm, σ 2 = 13.2 mm, and w 2 = 0.08.