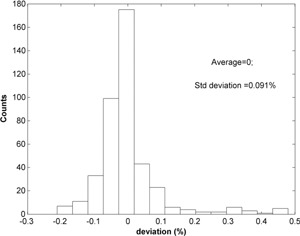
Figure 4.

The histogram of the FSF difference between the eclipse TPS and the in‐house method. The total of 420 comparisons includes 14 proton energies sampled from the highest (228.8 MeV) to the lowest proton energies (71.3 MeV), 6 field sizes from 2 to 20 cm, and 5 depths in the water from 20% to 80% of the proton range.
