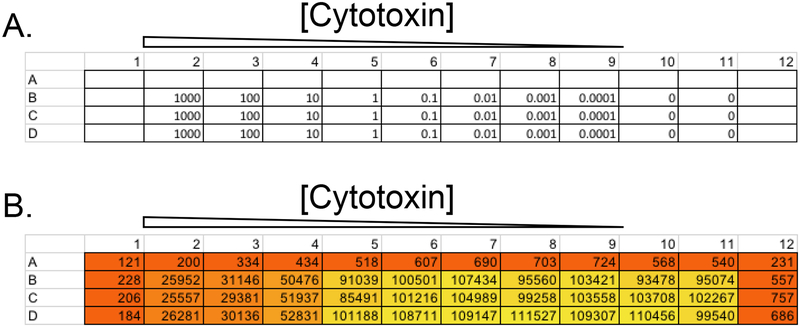
Figure 6. Determining an optimal concentration of a cytotoxin for a selection-based screen.
Shown is an example layout for a 96-well plate of cells used to determine the optimal concentration range of a cytotoxin. (A) Trametinib at indicated concentration (nM) was first added to the plate in 50 μL of growth medium. The same number of cells (50 μL of a cell suspension in fresh growth medium at 2 × 10⁵ cells/mL, or 10,000 cells per well) was then added to each well. (B) Cells were grown for 5 days and then subjected to Cell-Titer Glo assay. Arbitraty luminometry values from corresponding wells shown. 50 nM was ultimately chosen as an optimal concentration for the screen.

