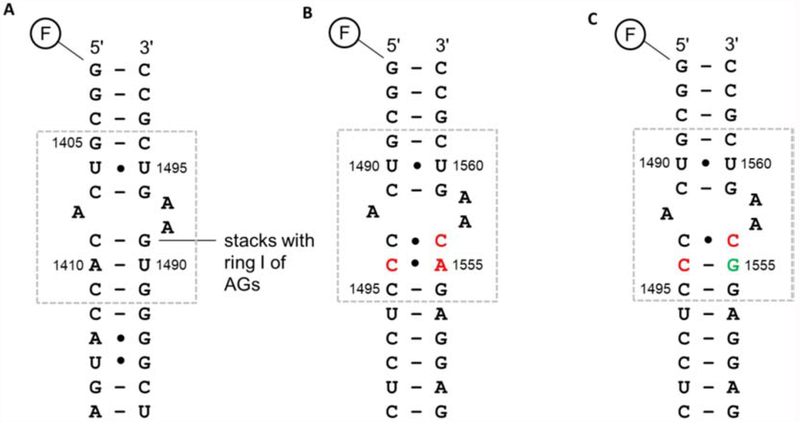
Figure 2. A-site RNA secondary structures.
RNA duplexes representing (A) E. coli (wt-bac), (B) wild-type human mitoribosomal (wt-mt), and (C) A1555G mutant human mitoribosomal (mut-mt) A-site sequences are shown (the A-site region is boxed). The nucleotides that are different in either wild-type or mutant mt sequences compared to the E. coli sequence are shown in red. The point mutation in the mut-mt sequence is shown in green. The rRNA numbering systems for E. coli and human mitochondria are used. The black dots (•) represent non-Watson-Crick base pairs and F is a 5′-fluorescein tag.

