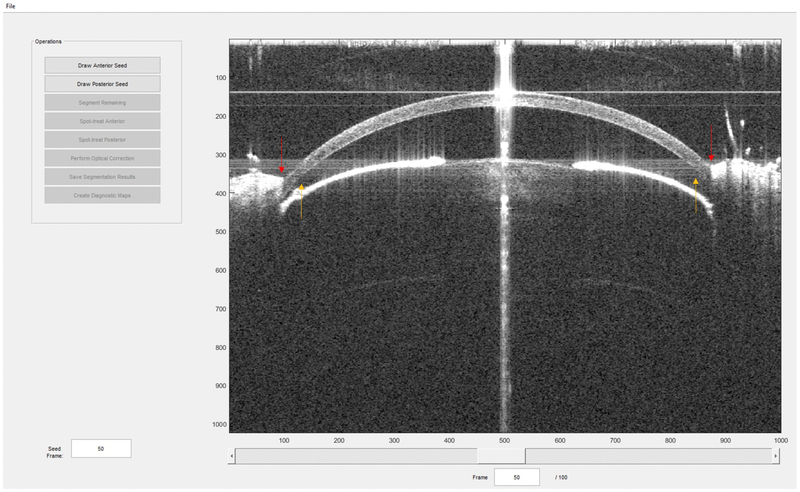
Figure 2. A sample screen capture of the MCAP (Mouse Corneal Analysis Program) with sample OCT data.
Program commands for image segmentation, optical dewarping, and map creation are located on the left. During processing, text will appear in lower left panel to display program status and corneal biometrics. Interactive pachymetry and topography maps (such as those in Fig. 6) on which the user can click to retrieve localized thickness and curvature measurements will be displayed in the main window, where the OCT image is currently displayed. Red arrows point out eyelids that may obscure the cornea. Orange arrows indicate areas of signal attenuation due to deviation from the center of depth of focus and system roll-off.

