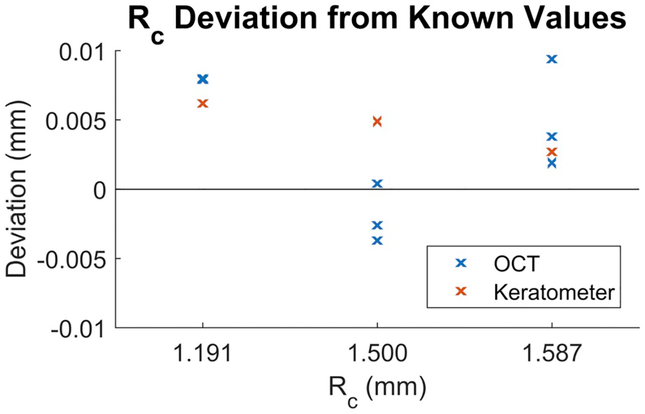
Figure 3. Deviation of Rc (in mm) from our OCT-based method (blue) versus keratometer (red) compared to known values of calibration spheres.
We measured accuracy and repeatability of our OCT-based method by imaging three calibration spheres from each dimension, for a total of nine data points in blue. Keratometer accuracy was also evaluated for each of the three sphere dimensions, giving a total of three data points in red. Average absolute bias was 0.005 mm for OCT and 0.004 mm for the keratometer. All values were within 1% of the manufacturer reported dimensions.

