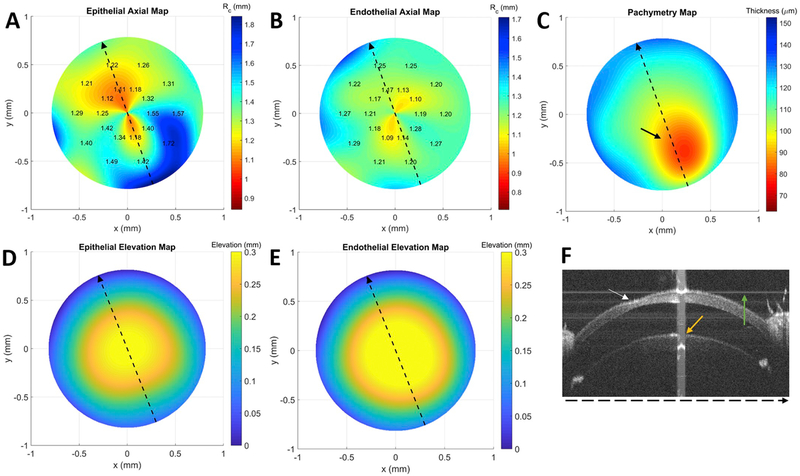
Fig. 6. Anterior (A) and posterior (B) curvature map, pachymetry map (C), anterior (D) and posterior (E) elevation maps, and sample OCT B-scan (F) for mouse (subject 3 OS) with corneal thinning.
The dotted lines in A-E represent the lateral location of the OCT scan (F). The area of corneal thinning is indicated by the black (C) or white arrow (F) and its subtle epithelial elevation abnormality can be seen in (D) near the coordinates (x,y) = (0.25,−0.3), especially when compared to the same location in its endothelial counterpart (E). Axial map limits are centered about mean RC specific to this cornea. The orange and green arrows in (F) correspond to saturation and background subtraction artifacts, respectively. (For interpretation of the references to color in this figure legend, the reader is referred to the Web version of this article.)

