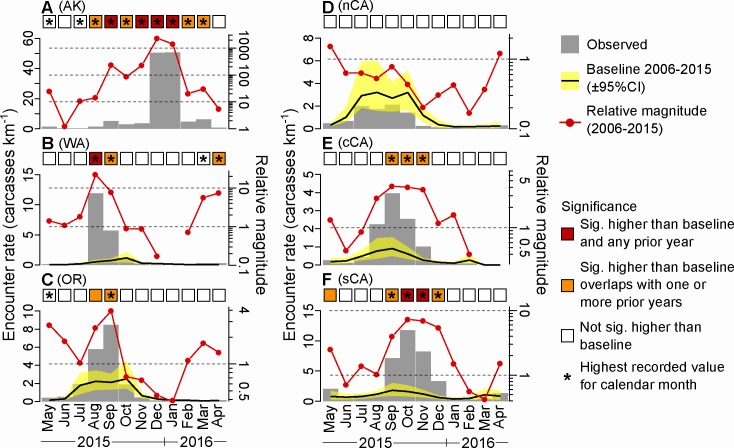
Fig 3.
Monthly averaged encounter rates (carcasses per km, gray bars) for the (A) Gulf of Alaska, (B) Washington, (C) Oregon, (D) northern California, (E) central California, and, (F) southern California coastlines. Black lines are baseline encounter rates, yellow shadings are 95% confidence intervals, and red lines show relative magnitude of encounter rates in 2015/2016 compared to the 2006–2015 baseline. Colored squares indicate whether month-averaged encounter rate was significantly higher than baseline and whether they were significantly higher than any prior year of data collection for that calendar month. Asterisks indicate that the mean encounter rate in the corresponding month was the highest value ever recorded. Note that the GOA baseline is so low that it cannot be seen on the chart. Relative magnitude was calculated as the 2015/2016 encounter rates divided by the baseline mean value.

