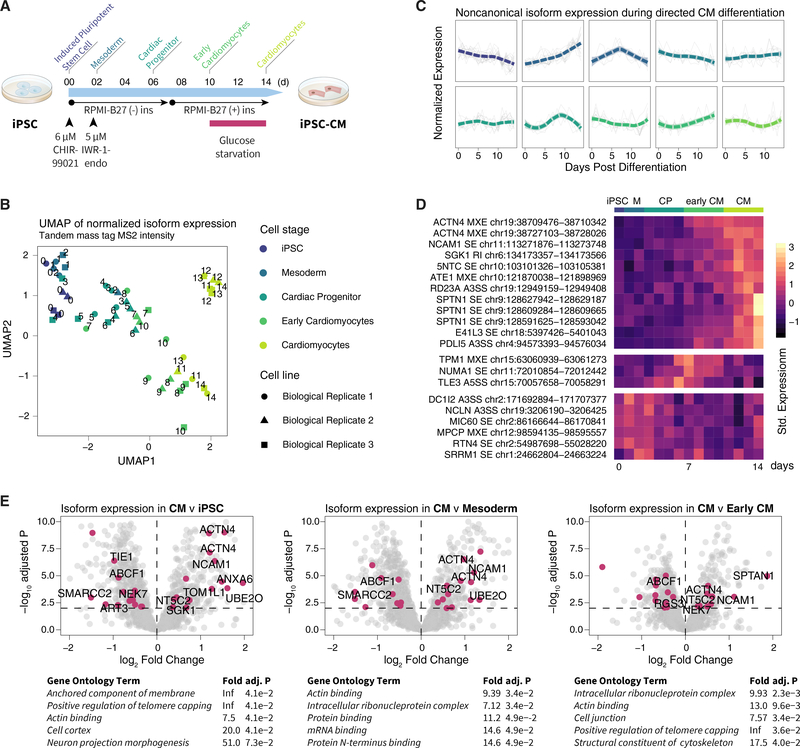
Figure 6. Expression of Protein Isoforms during iPSC Cardiac Differentiation.
(A) Schematic for human-iPSC-directed cardiac differentiation protocol with annotated stages (iPSC, day 0; mesoderm, day 1–2; cardiac progenitor, day 3–6; early CM, day 7–10; CM, day 11–14).
(B) UMAP projection of tandem mass tag intensity shows that total protein expression reflects differentiation stages (n = 3 biological replicates).
(C) Hierarchical clustering of noncanonical peptide expression during iPSC-CM differentiation shows diverse temporal behaviors of noncanonical isoforms in each cluster.
(D) Heatmap of row-standardized expression of noncanonical isoforms with cell-specific expression during differentiation (n = 3 biological replicates).
(E) Volcano plot of logFC versus −log10-adjusted p values comparing protein expression between CM with (left) iPSC, (center) mesoderm, and (right) early CM. Data points, isoforms; magenta, differentially expressed noncanonical isoforms (limmaadj. p ≤ 0.01); differentially expressed isoforms not found in SwissProt are labeled.

