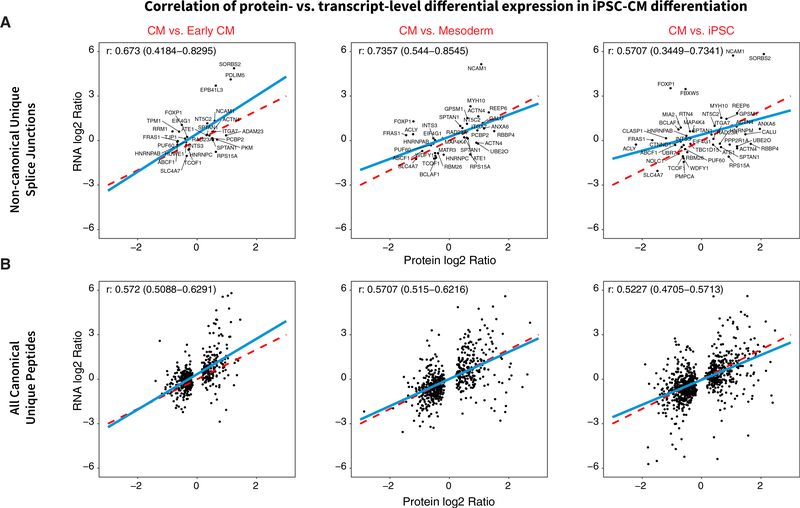
Figure 7. Correlation of Isoform Differential Regulation at Transcript and Protein Levels.
Scatterplots showing differential expression (logFC) of isoforms at transcript (y axis) versus protein (x axis) levels during iPSC-CM differentiation for noncanonical junction sequences only (A) and all canonical SwissProt unique sequences (B) that were quantified in both RNA-seq and MS and found to be differentially regulated. Protein and transcript isoform logFC show robust positive correlation (Pearson’s r, 0.57–0.74 noncanonical isoforms; 0.52–0.57 canonical). Blue line, best-fit linear regression; red dashed line, unity.

