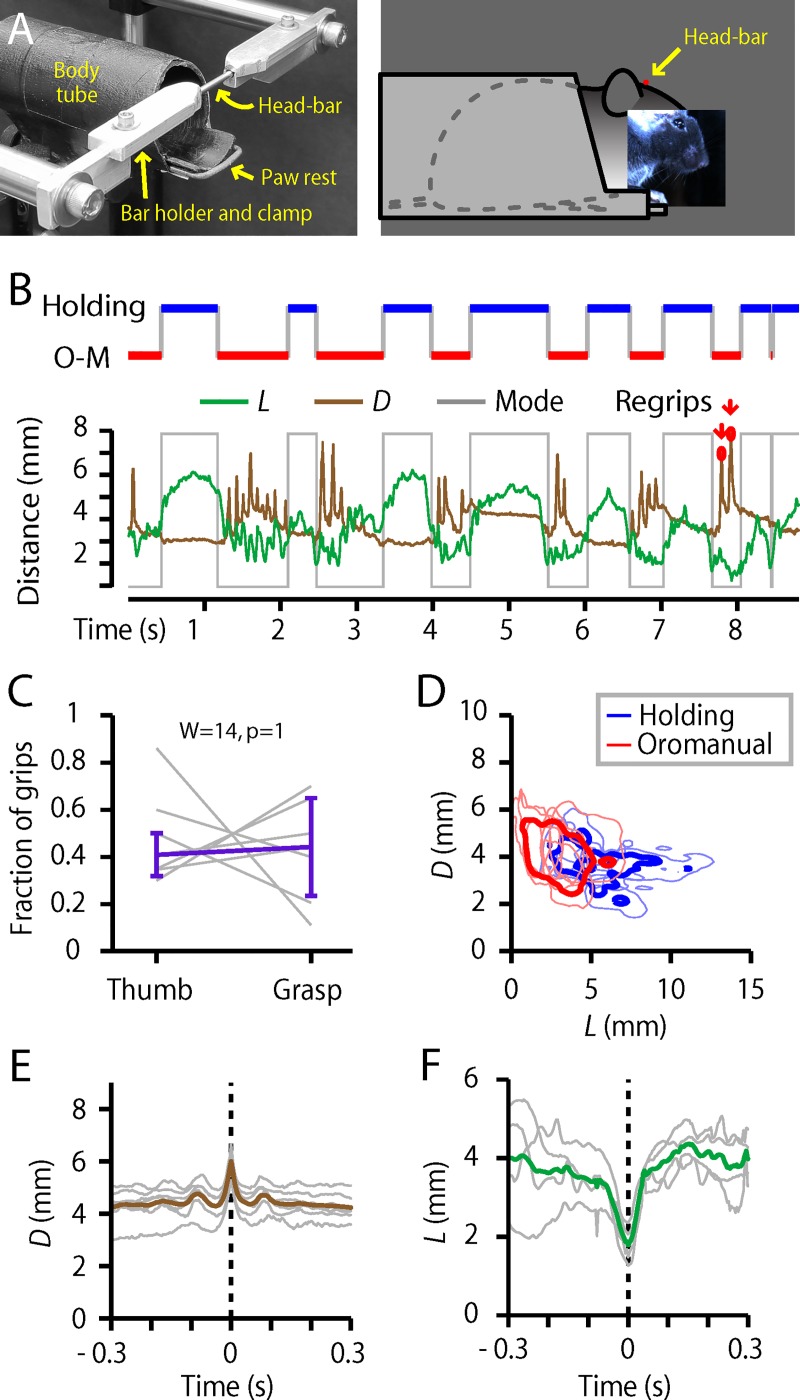
Fig 6. Head-fixed mice display largely similar D1 and hand movements.
(A) Head-fixation apparatus. Left image shows a view with the head-bar (rod) in place. Right image depicts the head-fixed mouse in the body tube. (B) Top: Example ethogram. Bottom: Time series of L (green) and D (brown), along with the same ethogram (gray). (C) Relative frequency of grip types (n = 7). (Not shown: indeterminate grip types.) (D) Right: L-D clustering for all mice handling flaxseeds while head-fixed. Light blue and red lines show the 10% maximum density contours lines for the holding and oromanual clusters, respectively, for each of n = 7 mice. Dark blue and red show the 10% contour lines of the average kernel smoothed density across all mice. (E) Right: Average peak-aligned regrip traces from each mouse (gray, n = 7) and the overall average (brown). (F) Right: Average peak-aligned sniff traces from each mouse (gray, n = 4 mice) and the overall average (green).

