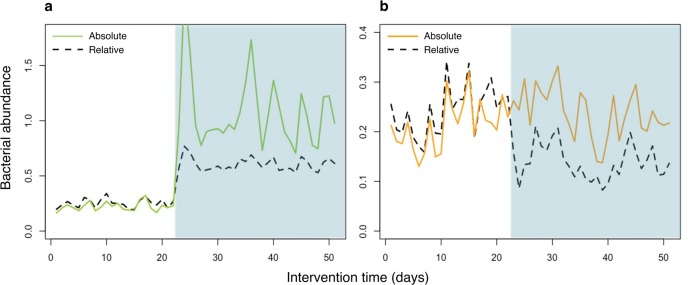
Fig 1. Compositionality leading to false positive discoveries.
To demonstrate the effect of compositionality on interpretation of microbiome NGS data, an intervention was simulated where a single taxon increased in abundance. The simulation was conducted in absolute abundance, which was converted to relative abundance for data analysis. (a) The intervention (shaded area) increased a single taxon (green solid line), which remained true when converted to relative abundance (black dashed line). (b) Other taxa (a single taxon represented here by the orange solid line) were not affected by the intervention. However, the relative abundance (black dashed line) shows a negative impact of the intervention, due to the increase in relative abundance of the affected taxon in (a).

