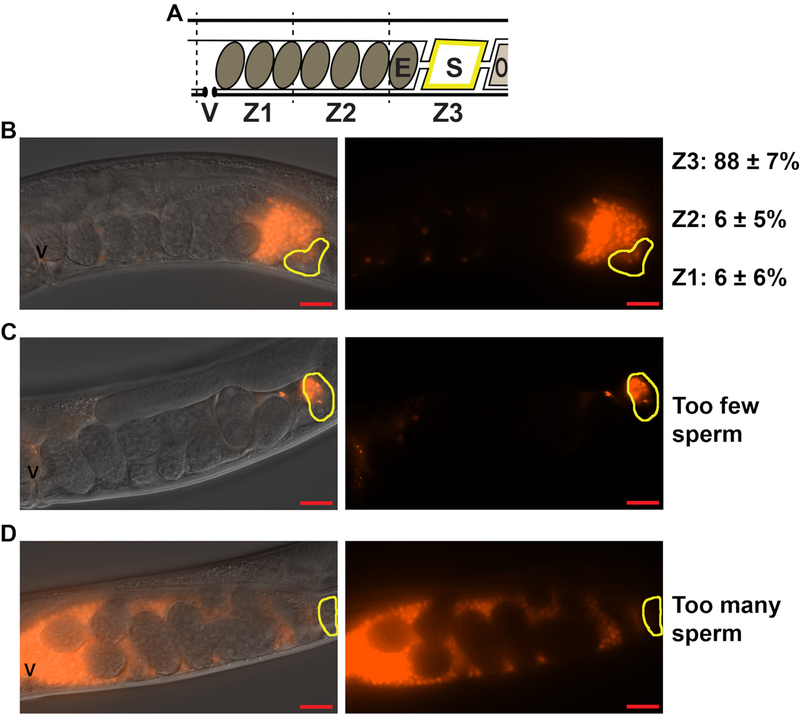
Figure 3: Quantifying sperm distribution within the hermaphrodite uterus.
(A). Schematic of the C. elegans hermaphrodite uterus. V = vulva, E = embryo, S = spermatheca, O = oocyte, Z1-Z3 = Zones 1–3 used to measure sperm distribution. (B-D). DIC+TRITC merged (left panels) and TRITC only (right panels) images of the wild-type hermaphrodite uteri 1 h after mating to fog-2(q71) males stained with the mito-dye. Sperm appear red. Yellow outlines indicate the location of the spermatheca. Scale bar: 20 μm. Z1, Z2, Z3 quantification in B represent the percent sperm in each zone ± standard deviation. Images in C and D represent matings that have resulted in too few (C) or too many (D) sperm for quantification.

