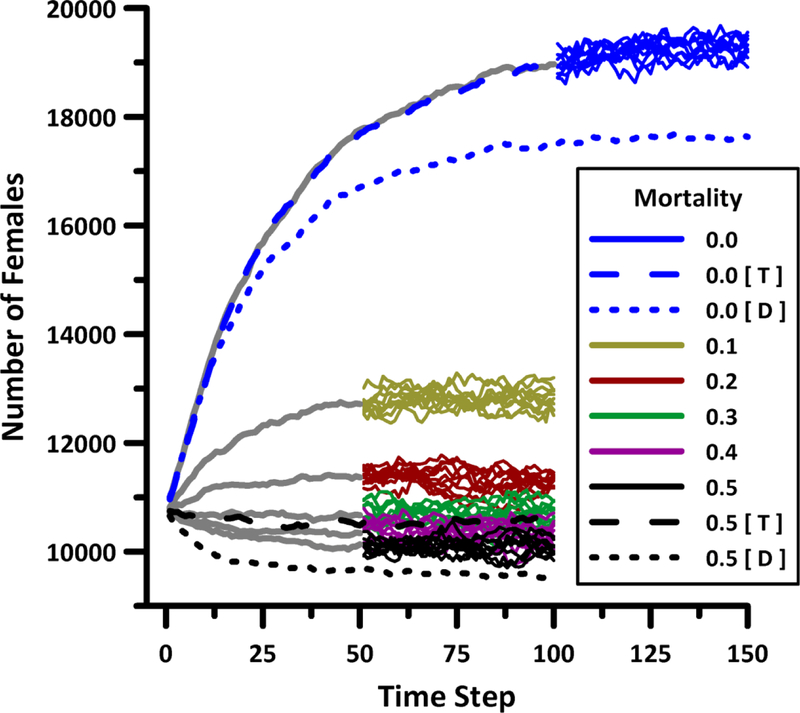
Figure 4.
Observed population sizes. Solid colored lines illustrate the steady-state results collected from groups of 10 replicates having the indicated mortality rate, (simulation ID 0–5 in Table 2). Gray lines represent corresponding mean values prior to steady-state. Dashed lines illustrate mean values for replicate simulations in which all non-lethal encounters resulted exclusively in transmission [T] or deflection [D] (simulation ID 6–9 in Table 2).

