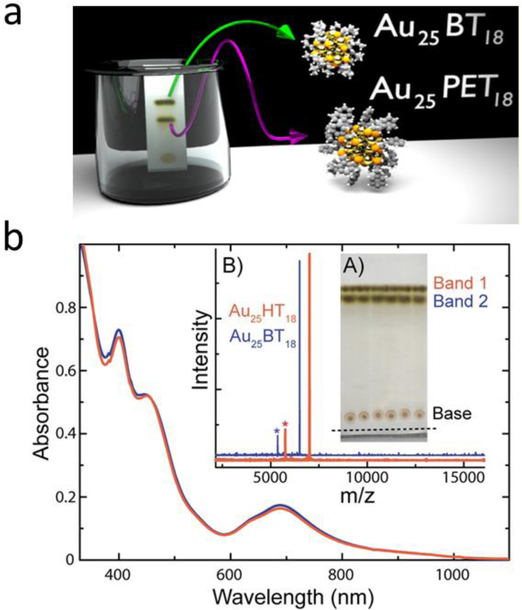
Figure 10.
(a) Scheme for the TLC plate used for the separation of NCs. (b) UV–Vis spectra of the TLC separated materials. (A) Photograph of the TLC plate used for cluster separation. Bands 1 and 2 are due to two separated clusters. The base shows the location where the mixture was spotted. The level of liquid is marked with a dashed line. (B) MALDI-MS data of TLC separated materials confirming that bands 1 (red trace) and 2 (blue trace) are pure Au25HT18 and Au25BT18, respectively. The fragmented product, Au21L14 is shown with an asterisk (*) in each trace. [83]. Copyright (2014) American Chemical Society.

