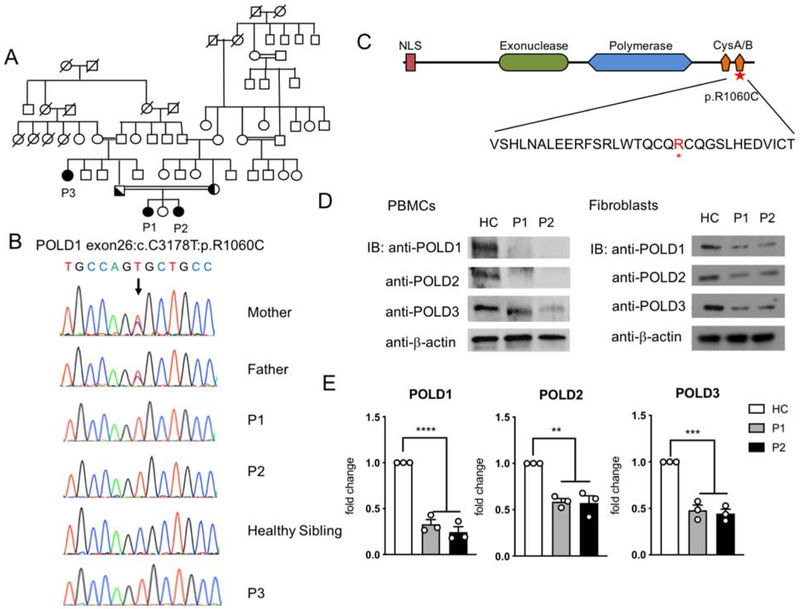
Figure 1. Characterization of a POLD1 mutation in kindred with combined immunodeficiency.
A. Patient Pedigree and familial segregation of the mutant POLD1 allele. Double lines connecting parents indicate consanguinity. Probands are indicated as P1-P3. Squares, Male subjects; circles, female subjects; solid symbols, patients; half-filled symbols, heterozygous. B. Sanger sequencing fluorograms of the germline c. 3178 C>T POLD1 mutation in patients P1-P3 and the parents of P1 and P2 compared with the equivalent DNA sequences in an unaffected healthy sibling (HS). C. Schematic representation of POLD1 protein. The different domains are depicted as follows: the nuclear localization signal (NLS) in red, the exonuclease in light green, the polymerase domain in light blue and the cysteine-rich metal-binding domains (CysA/B) in orange. The identified R1060C mutation and its position within the CysB polypeptide sequence is indicated by red star. D. Immunoblot analysis of POLD1/2/3 protein expression in PBMCs (left) and primary fibroblasts (right) of P1, P2 and a healthy control subject (HC). E. Quantitation of POLD1/2/3 protein expression in primary fibroblasts of P1 and P2, normalized for β-actin expression and expressed as fold change compared to that of HC fibroblasts (n=3; open circles). Results represent means ± S.E.M.**p<0.01; ***, p<0.001; ****, p<0.0001, by one-way ANOVA with Bonferroni post-test analysis.

