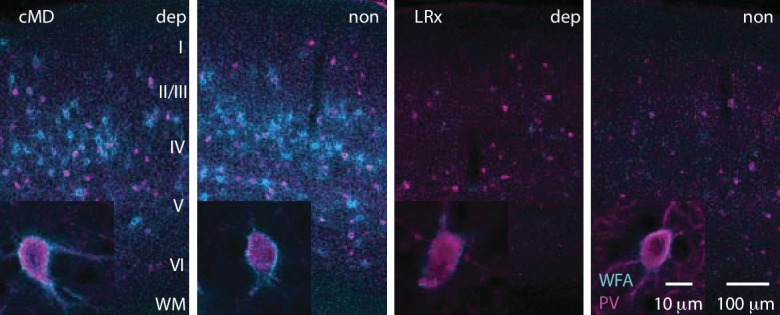
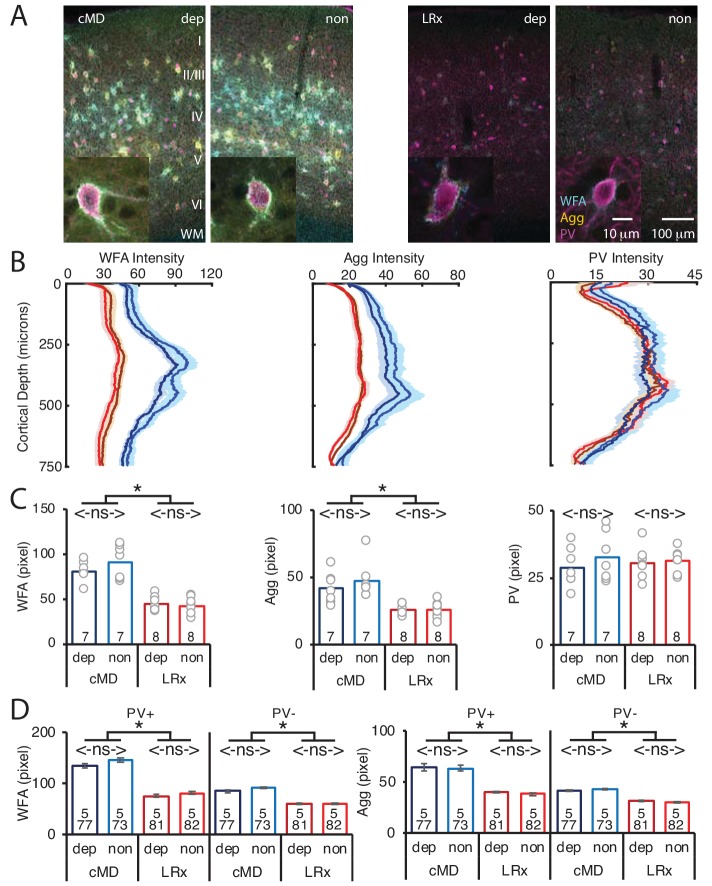
Figure 2. Parallel decrease in ECM integrity following LRx in deprived and non-deprived V1b.
(A) Representative triple labeled fluorescent micrographs of Wisteria floribunda agglutinin (WFA)-FITC staining (cyan), immunostaining for aggrecan (Agg; yellow) and parvalbumin (PV; magenta) in deprived (dep) and non-deprived (non) V1b in cMD (left) and cMD+LRx subjects (LRx, right). Roman numerals indicate cortical layer. WM = white matter. Inset: High magnification images of triple labeled PV+ interneurons (100X). (B) Fluorescence intensity profiles (mean ± SEM) along vertical depth of V1b. cMD dep (dark blue), cMD non (light blue), LRx dep (dark red), LRx non (red). (C) A parallel and significant decrease in WFA and Agg mean fluorescence intensity 250–400 μm from surface in dep and non V1b following LRx. One-way ANOVAs, WFA F(3, 26)=32, p=0.0001; Agg F(3, 26)=10, p=0.0001; PV F(3, 26)=0.4, p=0.75; n = 7, 7, 8, eight subjects for cMD dep, cMD non, LRx dep, LRx non, respectively; *p<0.05, Tukey-Kramer post hoc test. (D) LRx induces a significant decrease in WFA and Agg fluorescence intensity at PV+ and PV-locations in dep and non V1b. One-way ANOVAs, WFA PV+, F(3, 309)=40.3, p<0.0001; WFA PV-, F(3, 309)=30.1, p<0.0001; Agg PV+, F(3, 309)=29.4, p<0.0001; Agg PV-, F(3, 309)=18.7, p<0.0001; n (subjects, ROIs)=(5, 77 , 5, 73 , 5, 81 , 5, 82), for cMD dep, cMD non, LRx dep, LRx non, respectively; *p<0.05, Tukey-Kramer post hoc test.
Figure 2—figure supplement 1. Parallel decrease in ECM integrity following LRx in deprived and non-deprived V1.


