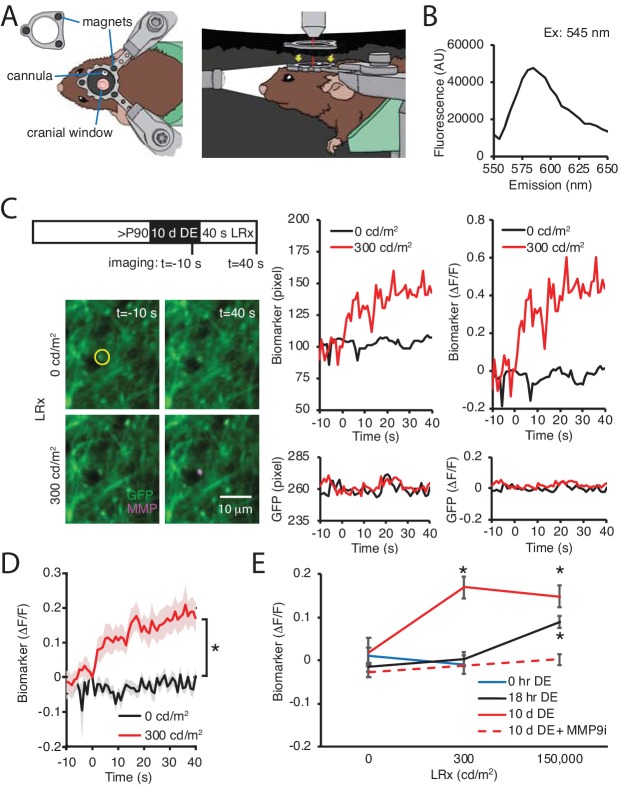
Figure 5. DE lowers the threshold for light-induced activation of MMP2/9.
(A) Dark chamber with an imaging window allows maintenance of visual deprivation during two photon live imaging of MMP2/9 biomarker. Left drawing: Top view of a subject wearing a custom aluminum headpost (1 cm diameter) magnetically held to an o-ring in the blackout ceiling of the dark camber (inset; 3 mm diameter magnets APEX magnets; magnetic field generation around V1,<20 gauss). The headpost is secured to a stereotax. The cannula for biomarker delivery is adjacent to theimaging window margin. Right drawing: Side view of a subject in the dark chamber. The headpost is magnetically attached to the o-ring opening of the blackout ceiling (magnet locations, yellow arrows). (B) In vitro emission spectrum of MMP2/9 biomarker A580 (2 ng/ml) incubated with activated rat recombinant MMP9 (rrMMP9, 100 ng). (C) Inset: Experimental timeline. Adult (>P90) WT mice received AAV-CaMKII-GFP~2 weeks before 10 d of DE. Biomarker was delivered 24 hr before imaging. Subjects received 40 s of light stimulation (1 Hz flash of 470 nm LED at 0 or 300 cd/m2). Left: Representative images of GFP (green) and biomarker (MMP, magenta) signals in V1b 10 s prior or 40 s after light stimulation at 0 or 300 cd/m2 in a DE subject. Right: Time course of raw fluorescent intensities (pixel) and ΔF/F of MMP biomarker (top) and co-localized GFP (bottom) within the single ROI denoted by yellow circle, from 10 s before (−10) to 40 s after (+40) light stimulation of 0 or 300 cd/m2 in a DE subject. (D) Summary data: Time course of ΔF/F of MMP biomarker from −10 s to +40 s of light stimulation of 0 or 300 cd/m2 in DE subjects. ΔF/F of MMP biomarker was stable in absence of visual stimulation (0 cd/m2) and increased over time in response to 300 cd/m2 light stimulation (mean ± SEM; Repeated measure ANOVA, F(1, 22), *p<0.001; n = 12 puncta from three subjects each). (E) Biomarker ΔF/F +40 s relative to 0 s as a function of DE (0, hr, 18 hr or 10 d) and light intensity (0, 300, or 150,000 cd/m2). Moderate intensity light did not induce a change in biomarker fluorescence in the absence of DE (blue line, p=0.49, Student’s T-test; n = 11, 10 puncta for 0 and 300 cd/m2, respectively). Following 18 hr of dark adaptation, a significant increase in biomarker fluorescence was observed in response to high, but not moderate intensity light (black line, One-way ANOVA, F(2, 45)=11.5, p<0.0001; n = 12, 12, 24 puncta for 0, 300, 150,000 cd/m2, respectively, *p<0.05, Tukey-Kramer post hoc test). Following 10 d DE, moderate and high intensity light significantly increased biomarker fluorescence (solid red line, One-way ANOVA, F(2, 40)=6.3, p=0.0042; n = 12, 12, 19 puncta for 0, 300, 150,000 cd/m2, respectively, *p<0.05, Tukey-Kramer post hoc test). The increase in biomarker fluorescence by 150,000 cd/m2 stimulation to 10 d DE subjects was inhibited by an MMP9 inhibitor delivered 24 hr before visual stimulation (MMP9i; 5 nM delivered i.c. 24 hr prior to LRx, dashed red line, p=0.13 Student’s T-test; n = 13 puncta for 0 and 150,000 cd/m2).

