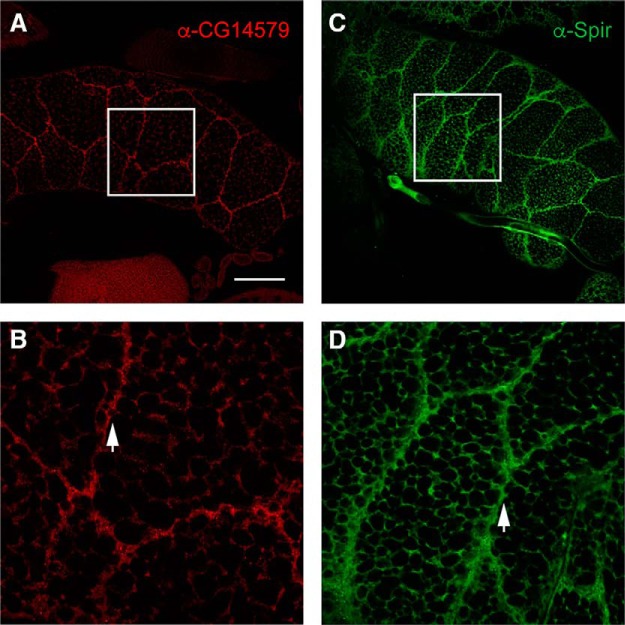
Figure 10.
Cellular localization of SPIRE and CCB. A–D, Salivary glands from third instar larvae. A, Monoclonal antibody showing CCB distribution in larval salivary glands. B, High-magnification images reveal a punctate pattern in the cytoplasm of the cells from the region marked in A. C, Monoclonal antibody showing SPIRE distribution in larval salivary glands. D, High-magnification images show a similar distribution of SPIRE in the cytoplasm of these cells. Scale bars: A, C, 65 μm; B, D, 18 μm.

