Figure 5.
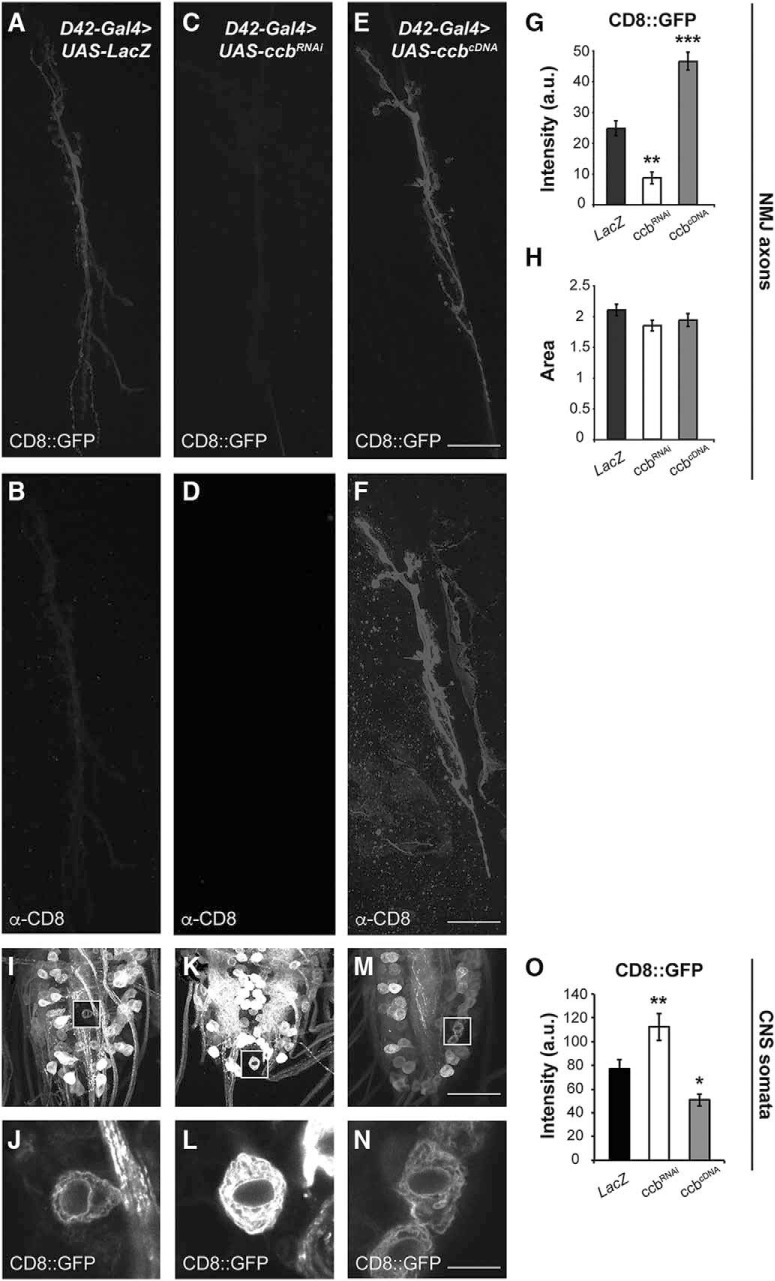
CCB-dependent vesicle-based axonal transport in larval motor neurons. A–F, NMJ of larval motor neurons innervating muscle fibers 6 and 7. Vesicular CD8::GFP accumulated at the larval NMJ is detected by the GFP signal in control (A; UAS-CD8::GFP/UAS-LAcZ, D42-Gal4/+), ccbRNAi expressing (C; UAS-CD8::GFP/+, D42-Gal4/UAS-ccbRNAi) and ccbcDNA expressing (E; UAS-CD8::GFP/+, D42-Gal4/UAS-ccbcDNA) animals. Membrane-translocated CD8 is detected by the α-CD8 antibody in the cellular membrane of control (B), ccbRNAi (D), and ccbcDNA (F)-expressing animals. M, Quantification of the vesicle-based axonal transport of CD8::GFP to the NMJ in control, ccbRNAi and ccbcDNA-expressing animals. Expression of ccbRNAi significantly reduces axonal transport of CD8 (Kruskal–Wallis, p = 0.0023), while ccb overexpression increases axonal transport of CD8 (Kruskal–Wallis, p = 0.0003). N, NMJ area measured as the fluorescence signal for each genotype shown in M. The size of the NMJ remains invariable among genotypes. I–N, Accumulation of CD8::GFP in the ventral ganglia of the larval CNS. Vesicular CD8::GFP accumulated in somata of the SNC motor neurons is detected by the GFP signal for control (I), ccbRNAi (K), and ccbcDNA (M) expressing animals. White squares show single-plane confocal images from regions of interest containing individual cell bodies. J, L, N, Magnification of the insets in I, K, M for the corresponding genotypes: control (J; UAS-CD8::GFP/UAS-LAcZ, D42-Gal4/+), ccbRNAi (L; UAS-CD8::GFP/+, D42-Gal4/UAS-ccbRNAi) and ccbcDNA (N; UAS-CD8::GFP/+, D42-Gal4/UAS-ccbcDNA). O, Quantification of the GFP signal (I, K, M) shows significant retention of CD8::GFP in the soma of motor neurons expressing the ccbRNAi (K; Kruskal–Wallis, p = 0.0064), and a reduction of the GFP signal in somata of animals expressing the ccbcDNA in larval motor neurons (M; Kruskal–Wallis, p = 0.0138). Error bars indicate SEM. *p < 0.05, **p < 0.01, ***p < 0.001; n = 5–10 per group. Scale bars: A–F, 12 μm; I, K, M, 48 μm; J, L, N, 8 μm.

