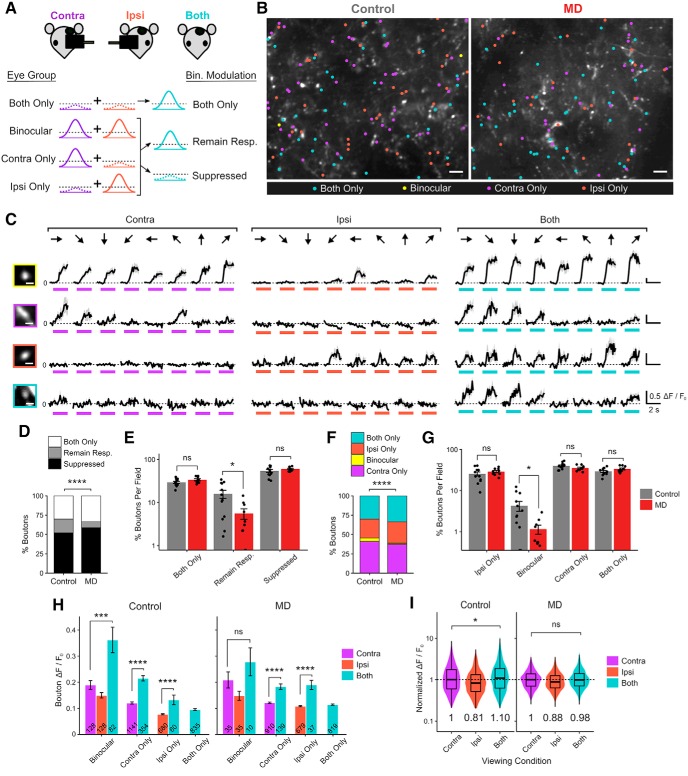
Figure 10.
Long-term critical-period MD impairs binocular facilitation of thalamocortical boutons. A, Illustration of three modes of binocular modulation of visual responses: both only, remaining responsive, and suppressed. Broken lines indicate noise floor. B, Example FOVs (summed projection) of dLGN boutons imaged in bV1, color-coded according to eye group, including both-only in control versus MD mice. Scale bar, 10 μm. C, Example Ca2+ signals in a binocular (top), contra-only and ipsi-only (middle), and both-only (bottom) boutons in response to drifting gratings presented to contra-eye, ipsi-eye, and both eyes. Black represents mean trace. Gray represents mean ± SEM of 8 repeats. Colored bars represent time of stimulus presentation. Scale bar, 2 μm. Responses to 8 orientations at peak SF are shown. D, Fractions of dLGN boutons according to mode of binocular modulation in control versus MD mice (χ2(2) = 119.40, p = 2 × 10⁻¹⁶). E, Percentage of boutons that are both-only, remaining responsive, suppressed per field in control versus MD mice (mean ± SEM per field). Control, both-only: 29.6 ± 1.6%; remaining responsive: 15.8 ± 3.4%; suppressed: 54.5 ± 4.1%. MD, both-only: 33.9 ± 1.8%; remaining responsive: 5.6 ± 1.5%; suppressed: 60.4 ± 2.3%. t tests, effect of MD for both-only: p = 0.10; remaining responsive: p = 0.01; suppressed: p = 0.22; n = 12 fields in 5 control mice, 9 fields in 5 MD mice. F, Fractions of visually responsive dLGN boutons according to eye group in control versus MD mice (χ2(3) = 57.23, p = 2 × 10⁻¹²). G, Percentages of boutons in each eye group (ipsi-only, binocular, and contra-only, both-only) in control versus MD mice (mean ± SEM per field). t tests, effect of MD for ipsi-only: p = 0.32; binocular: p = 0.02; contra-only: p = 0.10; both-only: p = 0.10. H, Response amplitude Rpref of boutons under different viewing conditions (mean ± SEM of all sample). Linear mixed-effects models. Control: contra-eye versus both-eye viewing in binocular boutons: F = 17.07, p = 5 × 10⁻⁵; monocular versus both-eye viewing in contra-only boutons: F = 79.16, p = 2 × 10⁻¹⁶; in ipsi-only boutons: F = 53.39, p = 7 × 10⁻¹³; MD: contra-eye versus both-eye viewing in binocular boutons: F = 0.003, p = 0.96; monocular versus both-eye viewing in contra-only boutons: F = 77.93, p = 2 × 10⁻¹⁶; in ipsi-only boutons: F = 75.43, p = 2 × 10⁻¹⁶. Numbers inside bars indicate numbers of boutons. I, Violin and overlaid box plots of response amplitude Rpref of boutons during contra-eye, ipsi-eye, and both-eye viewing conditions, normalized to contra-eye viewing median values (medians indicated by numbers below violin plots). Linear mixed-effects models, contra-eye versus both-eye viewing in controls: F = 4.59, p = 0.03; in MD mice: F = 1.06, p = 0.30. In box plots, middle mark indicates the median, and bottom and top edges indicate 25th and 75th percentiles, respectively. D–I, n = 2784 boutons in 5 control mice, 2443 boutons in 5 MD mice. ns, Not significant at p > 0.05. *p < 0.05, ***p < 0.001, ****p < 0.0001.

