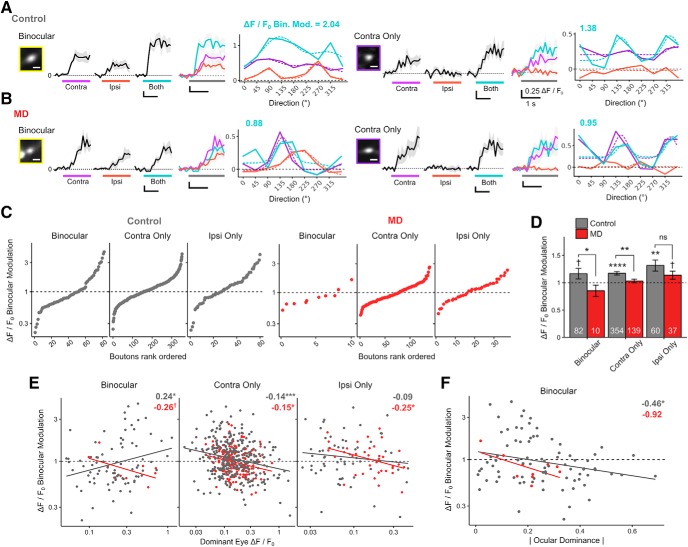
Figure 11.
Long-term MD-induced impairment of binocular modulation affects binocular and monocular thalamocortical boutons. A, B, Normalized Ca2+ signals from two example dLGN boutons from control (A) and MD (B) mice. Binocular dLGN boutons (left) and contra-only monocular boutons (right), as well as their respective bouton images and orientation tuning curves. Traces are in response to drifting gratings presented to contra-eye, ipsi-eye, and both eyes. Black represents mean trace. Gray represents mean ± SEM of 8 repeats. Colored bars represent time of stimulus presentation. Scale bar, 2 μm. Numbers above tuning curves indicate binocular modulation values (binocular Rpref/dominant-eye monocular Rpref). C, Binocular, contra-only, and ipsi-only dLGN boutons are shown rank-ordered according to binocular modulation. Both binocular facilitation and suppression exist in control (left) and MD (right) mice. D, Binocular modulation of visual responses for binocular, contra-only, and ipsi-only boutons in control versus MD mice (mean ± SEM of all sample; numbers inside bars indicate number of boutons; t tests against 1 for binocular control: p = 0.08; contra-only control: p = 2 × 10⁻⁸; ipsi-only control: p = 0.002; binocular MD: p = 0.18; contra-only MD: p = 0.34; ipsi-only MD: p = 0.07. t tests between control versus MD for binocular: p = 0.03; contra-only: p = 0.002; ipsi-only: p = 0.16. E, Scatter plots and linear regression of binocular modulation as a function of dominant-eye monocular Rpref for binocular, contra-only, and ipsi-only boutons in control (gray) and MD (red) mice. F, Scatter plots and linear regression of binocular modulation as a function of absolute OD for binocular boutons in control (gray) and MD (red) mice. C–F, Broken lines indicate no binocular modulation. E, F, Numbers on top right indicate estimated slope (symbols indicate p values). Solid colored lines indicate linear regression fits. Gray represents control. Red represents MD. C–F, n = 496 boutons in 5 control mice, 186 boutons in 4 MD mice. ns, Not significant at p > 0.1. †p < 0.1, *p < 0.05, **p < 0.01, ***p < 0.001, ****p < 0.0001.

