Figure 12.
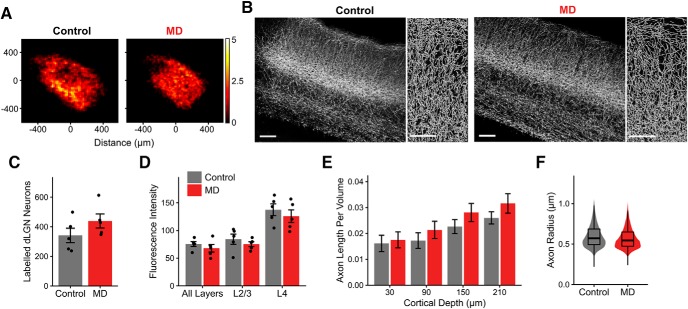
No evident structural loss of thalamocortical connectivity following long-term critical-period MD. A, Heatmaps showing spatial distribution of dLGN neurons labeled following GCaMP6s virus injection in control (left) and MD (right) mice. Of 10 mice included in this dataset, 6 were part of functional dataset obtained using in vivo two-photon calcium imaging. Heatmaps are based on summed cell counts across all sections and mice. B, Left, Example fluorescence images (maximal projection of confocal z stacks) of V1 coronal sections showing dLGN axon labeling in control and MD mice. Scale bar, 100 μm. Sections were immunostained for GFP. Right, Semiautomatically traced axons in L1–2/3 in control and MD mice. Scale bar, 50 μm. Images in B are from the same mice shown in Figure 3A. C, Number of dLGN neurons labeled in control versus MD mice (mean ± SEM by animal; t test: p = 0.19). D, Mean fluorescence intensity of labeling in V1 sections from control versus MD mice, shown for all layers, L2/3 only, and L4 only (mean ± SEM by animal; two-way ANOVA, effect of MD: F = 1.95, p = 0.18, effect of layer: F = 31.14, p = 2 × 10⁻⁷). E, Traced axon length per volume (μm per μm3) across binned cortical depths in V1 L1–2/3 in control versus MD mice (mean ± SEM by section; linear mixed-effects model, effect of MD: F = 0.04, p = 0.84, effect of cortical depth: F = 65.64, p = 8 × 10⁻¹³). F, Violin and overlaid box plots represent distribution of traced axon radius in V1 L1–2/3 in control versus MD mice (linear mixed-effects model, effect of MD: F = 0.35, p = 0.57). In box plots, middle mark indicates the median, and bottom and top edges indicate 25th and 75th percentiles, respectively. All panels, n = 5 control and 5 MD mice, 3 sections per animal.

