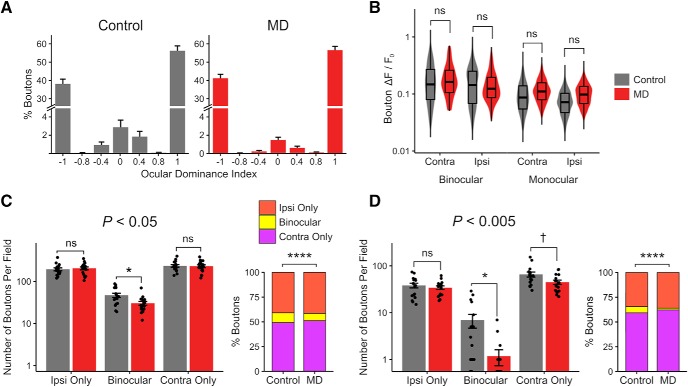
Figure 2.
Loss of binocular dLGN boutons without a reduction in response strength. A, ODI histogram of dLGN boutons in control versus MD mice (mean ± SEM per field, n = 17 fields in 5 control mice, 20 fields in 6 MD mice). B, Violin and overlaid box plots of mean response amplitude Rpref of dLGN boutons in control versus MD mice. Linear mixed-effects model, effect of MD: F = 0.32, p = 0.58; binocular versus monocular: F = 259.47, p = 2 × 10⁻¹⁶; contra versus ipsi: F = 44.48, p = 2 × 10⁻¹¹; n = 2866 boutons in 5 control mice, 3503 boutons in 6 MD mice. C, D, The binocular bouton loss following critical-period MD (Fig. 1H,J) is shown using two additional statistical criteria in determining visual responsiveness: more liberal (C: p < 0.05) or more conservative (D: p < 0.005) than the typical criterion used in this study (p < 0.01; see Materials and Methods). Linear mixed-effects models, effect of MD for ipsi-only: p = 0.75 (C), p = 0.55 (D); for binocular: p = 0.01 (C), p = 0.01 (D); for contra-only: p = 0.93 (C), p = 0.05 (D). χ2 tests: for C, χ2(2) = 37.50, p = 7 × 10⁻⁹, n = 8099 versus 11,028 visually responsive boutons in total, 10% versus 7% binocular (control vs MD); for D, χ2(2) = 54.25, p = 1 × 10⁻¹², n = 1887 versus 2211 visually responsive boutons in total, 6% versus 2% binocular (control vs MD). The binocular bouton loss in MD mice remains statistically significant under different data inclusion criteria. In box plots, middle mark indicates the median, and bottom and top edges indicate 25th and 75th percentiles, respectively. ns, Not significant at p > 0.1. †p < 0.1, *p < 0.05, ****p < 0.0001.

