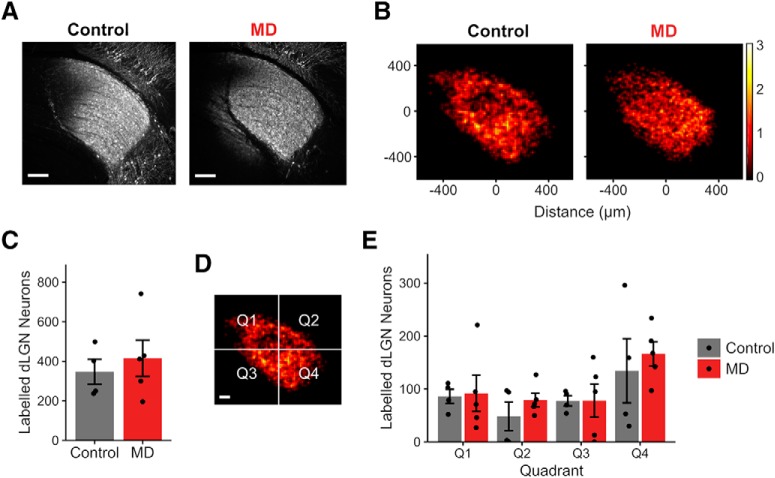
Figure 3.
GCaMP6s labeling in dLGN is comparable between control and MD mice used for functional thalamocortical axon imaging. A, Example fluorescence sections of dLGN neurons labeled following GCaMP6s virus injection in control (left) and MD (right) mice that were used for in vivo two-photon Ca2+ thalamocortical axon imaging. Sections were immunostained for GFP. Scale bar, 100 μm. Example sections in A are from the same mice shown in Figure 12B. B, Heatmaps showing spatial distribution of labeled dLGN neurons in control and MD mice. Heatmaps are based on summed cell counts across all sections and mice. C, Numbers of dLGN neurons labeled were similar between functionally imaged control versus MD mice (mean ± SEM by animal values; t test, p = 0.56). D, Quadrants used in quantifying spatial distribution of labeled dLGN neurons. Scale bar, 100 μm. E, Numbers of labeled dLGN neurons were similar between control and MD mice across all quadrants (mean ± SEM by animal values; two-way ANOVA, control vs MD: F = 0.65, p = 0.43, effect of quadrant: F = 3.31, p = 0.03, interaction: F = 0.15, p = 0.93). B–E, n = 4 control and 5 MD mice, cells counted from three sections per animal.

