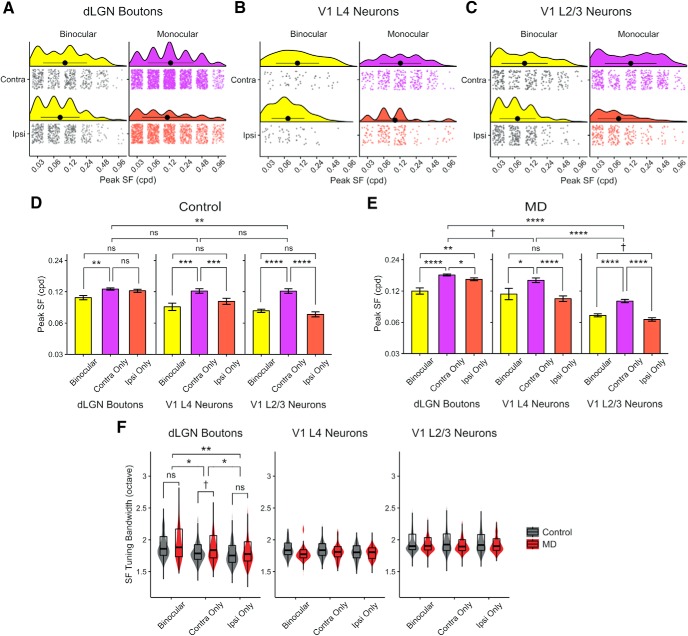
Figure 5.
Comparison of SF tuning properties of dLGN boutons, V1 L4 and L2/3 neurons. A–C, Control data only. A, Raincloud plots represent distributions of peak SF in binocular (left) and monocular (right) (purple represents contra-only; orange represents ipsi-only) dLGN boutons during contralateral- (top) and ipsilateral-eye (bottom) visual stimulation. Individual data points are plotted jittered to avoid overplotting. Black filled circles and lines represent mean ± SD. B, Distribution of peak SF in V1 L4 neurons. C, Distribution of peak SF in V1 L2/3 neurons. D, Mean peak SF (mean ± SEM of all sample) of binocular, contra-only, and ipsi-only dLGN boutons (left), V1 L4 neurons (middle), and V1 L2/3 neurons (right) in control mice. Linear mixed-effects models. Boutons versus L4 neurons: F = 2.37, p = 0.16; boutons versus L2/3 neurons: F = 10.96, p = 0.004; L4 versus L2/3 neurons: F = 0.06, p = 0.80; binocular versus contra-only boutons: F = 7.94, p = 0.004; binocular versus ipsi-only boutons: F = 1.98, p = 0.15; contra-only versus ipsi-only boutons: F = 2.29, p = 0.12; binocular versus contra-only L4 neurons: F = 11.83, p = 0.0006; binocular versus ipsi-only L4 neurons: F = 0.001, p = 0.96; contra-only versus ipsi-only L4 neurons: F = 13.46, p = 0.0002; binocular versus contra-only L2/3 neurons: F = 42.71, p = 9 × 10⁻¹¹; binocular versus ipsi-only L2/3 neurons: F = 1.54, p = 0.21; contra-only versus ipsi-only L2/3 neurons: F = 38.33, p = 9 × 10⁻¹⁰. E, Mean peak SF (± SEM) of binocular, contra-only, and ipsi-only dLGN boutons and V1 L4, L2/3 neurons in MD mice (same convention as D). Linear mixed-effects models. Boutons versus L4 neurons: F = 4.26, p = 0.05; boutons versus L2/3 neurons: F = 130.63, p = 3 × 10⁻¹⁰; L4 versus L2/3 neurons: F = 58.09, p = 1 × 10⁻⁶; binocular versus contra-only boutons: F = 24.37, p = 8 × 10⁻⁷; binocular versus ipsi-only boutons: F = 8.61, p = 0.003; contra-only versus ipsi-only boutons: F = 4.90, p = 0.02; binocular versus contra-only L4 neurons: F = 3.91, p = 0.04; binocular versus ipsi-only L4 neurons: F = 0.50, p = 0.47; contra-only versus ipsi-only L4 neurons: F = 24.67, p = 9 × 10⁻⁷; binocular versus contra-only L2/3 neurons: F = 40.21, p = 3 × 10⁻¹⁰; binocular versus ipsi-only L2/3 neurons: F = 3.37, p = 0.06; contra-only versus ipsi-only L2/3 neurons: F = 52.40, p = 8 × 10⁻¹³. F, Violin and overlaid box plots of SF tuning bandwidth in binocular, contra-only, and ipsi-only dLGN boutons (left), V1 L4 neurons (middle), and V1 L2/3 neurons (right) in control versus MD mice. Linear mixed-effects models. Boutons: effect of MD: F = 2.65, p = 0.12; effect of eye group: F = 4.42, p = 0.01. Post hoc tests, binocular versus contra-only: F = 4.09, p = 0.04; binocular versus ipsi-only: F = 7.49, p = 0.006; contra-only versus ipsi-only: F = 4.02, p = 0.04. V1 L4 neurons: effect of MD: F = 1.04, p = 0.30; effect of eye group: F = 0.72, p = 0.48. V1 L2/3 neurons: effect of MD: F = 0.54, p = 0.47; effect of eye group: F = 0.42, p = 0.65. In box plots, middle mark indicates the median, and bottom and top edges indicate 25th and 75th percentiles, respectively. All panels: n = 2866 boutons in 5 control mice, 3503 boutons in 6 MD mice; 572 L4 neurons in 3 control mice, 565 L4 neurons in 2 MD mice; 1051 L2/3 neurons in 9 control mice, and 1355 L2/3 neurons in 6 MD mice. ns, Not significant at p > 0.1. †p < 0.1, *p < 0.05, **p < 0.01, ***p < 0.001, ****p < 0.0001.

